


.avif)
Have you ever run a correlation analysis on your marketing data? Generations of marketers have used this statistical analysis to help them understand the relationships between their spend, revenue, ad and performance over time.
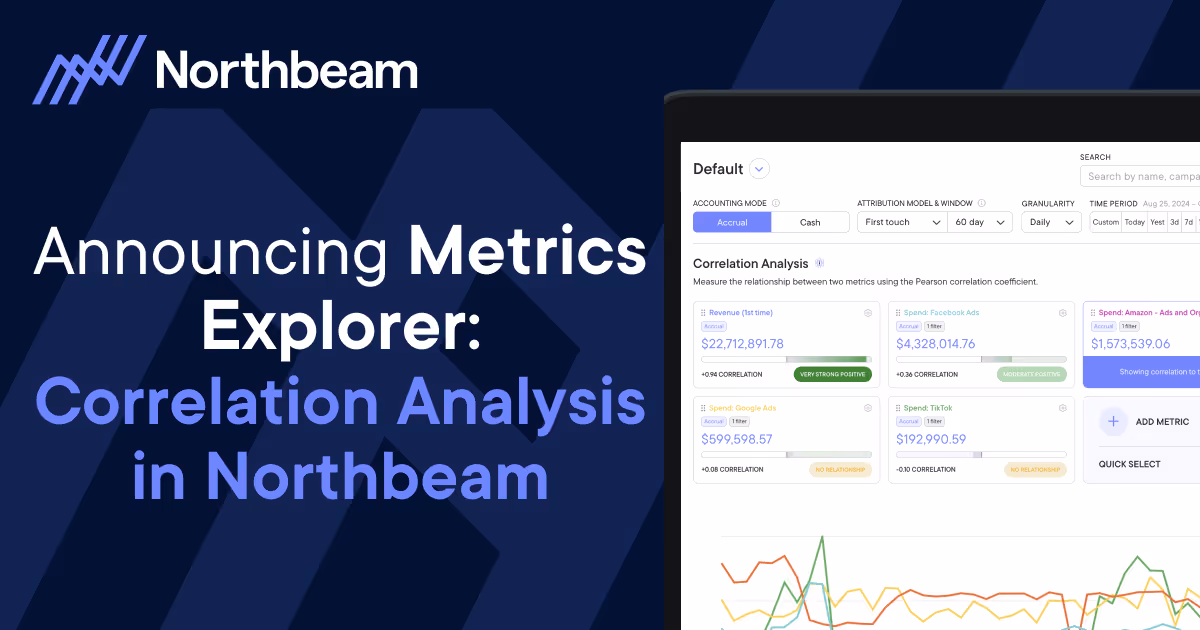
We're thrilled to announce the launch of Metrics Explorer, a powerful new dashboard inside Northbeam that revolutionizes how marketers run correlation analyses. Metrics Explorer empowers you to visualize the direction and intensity of relationships between various marketing metrics over time, providing unprecedented insights into your marketing strategy's effectiveness.
How to Use Metrics Explorer
With Metrics Explorer, you can:
- Understand cross-channel effects (e.g., how Facebook ads impact Amazon revenue)
- Evaluate the strength of relationships between ad spend and key performance indicators
- Uncover unexpected correlations that could inform future marketing strategies
Metrics Explorer is useful at any stage of the marketing process, from ideation to reporting. You can use Metrics Explorer to add statistical rigor throughout your marketing work, increasing trust in both the data and your strategic vision.
Unlock the Power of Correlation
At the heart of Metrics Explorer lies the Pearson Correlation Coefficient, a widely-trusted statistical model that forms the foundation for uncovering meaningful connections in your data. This robust tool allows you to:
- Measure correlations over unlimited, customizable time periods
- Analyze data using various attribution models and lookback windows of your choosing
- Adjust granularity (daily/weekly/monthly) in the data
Metrics Explorer makes it easier than ever to add correlation analysis to your marketing toolbox - and it all runs on Northbeam’s first-party data.
Gain Confidence in Your Marketing Decisions
Metrics Explorer helps you understand how specific ad campaigns, spending flights, or performance trends affect other aspects of your marketing strategy. For instance, you might discover a moderately strong relationship between your Facebook Spend and Google Branded Search Revenue over the last 90 days.
By visualizing these results, Metrics Explorer makes it easier than ever for you to include robust statistical analysis in all your marketing reporting, whether you’re forecasting for the future or analyzing past performance.
Create and save customized views tailored to your specific needs, then export them with ease. Metrics Explorer streamlines your reporting process, allowing you to focus on deriving actionable insights from your data.
Like all Northbeam dashboards, Metrics Explorer harnesses the power of your exclusive first-party data, ensuring that the insights you gain are truly relevant to your business.
Availability and Enterprise Features
Metrics Explorer is now available to all Northbeam users. Enterprise-tier customers enjoy the added benefit of analyzing multiple correlations simultaneously. Contact our sales team to learn more about upgrading to Enterprise.
With Metrics Explorer, you'll gain a deeper understanding of your marketing ecosystem, allowing you to make data-driven decisions with greater confidence than ever before. Start exploring your metrics today and unlock the full potential of your marketing data!
Want to learn more? See our Quick Start Guide, or read our Best Practices Guide.


.svg)
