


A newsletter for modern marketers.

TRUSTED BY THE WORLD'S SMARTEST MARKETERS


Free ad performance benchmarks every week.
Live webinars and strategy sessions with industry leaders.
Watch all previous episodes on our YouTube channel.
Insider strategies from the smartest brands in ecommerce.
SEE LATEST POSTS:

The $100k–$200k monthly spend band is Amazon's efficiency frontier

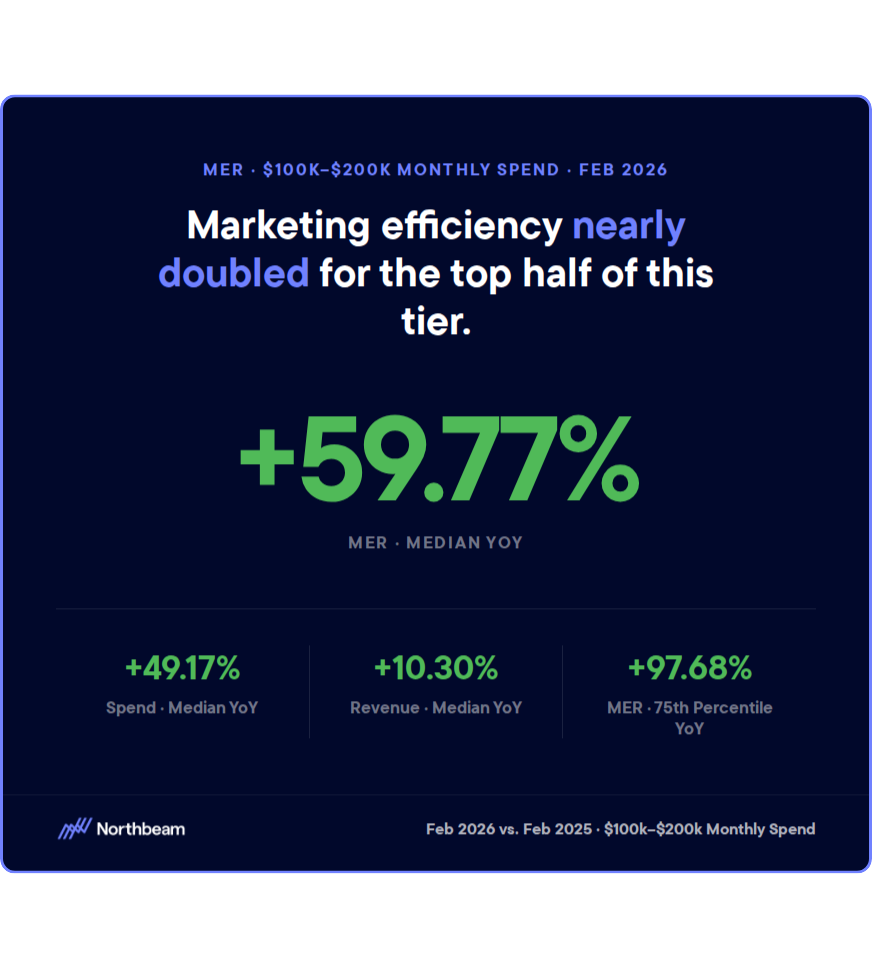
In February 2026, one Amazon spend tier separated itself from the rest of the market: businesses spending between $100,000 and $200,000 per month on the platform grew median spend by 49.17 percent year over year, grew median revenue by 10.30 percent, and improved median MER by 59.77 percent. No other spend cohort in this dataset achieved all three simultaneously. Most achieved none.
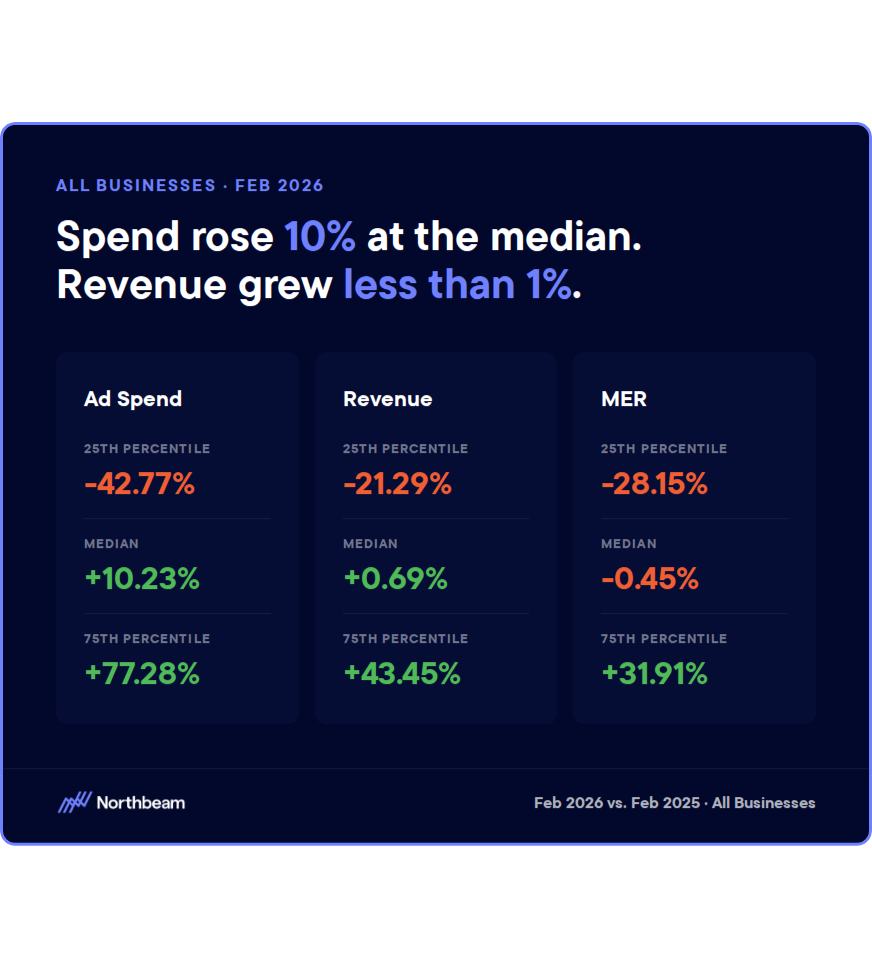
Across the broader Amazon market in February 2026, the picture is one of spend outrunning return. Median spend grew 10.23 percent year over year while median revenue grew just 0.69 percent and median MER declined 0.45 percent. That is the backdrop against which the $100k–$200k tier stands out: not just as a relative winner, but as a genuine anomaly worth understanding.
February 2026: aggregate Amazon performance
At the median across all businesses in this dataset, February delivered a familiar Q1 pattern: flat revenue, rising spend, and pressure on efficiency. Median revenue growth of 0.69 percent year over year does not justify a 10.23 percent increase in spend. The gap between those two numbers points to either rising CPCs, declining conversion rates, or both. The aggregate MER figure of -0.45 percent confirms that, at the market level, February 2026 slightly underperformed the same month in the prior year on efficiency terms.
The 25th to 75th percentile spread makes the bifurcation visible. February is not a month where the median operator is having a clean experience. The question is which cohorts are escaping the aggregate weakness, and why.
- Spend: 25th percentile -42.77% to 75th percentile +77.28% — a 120 percentage point spread
- Revenue: 25th percentile -21.29% to 75th percentile +43.45%
- MER: 25th percentile -28.15% to 75th percentile +31.91% — the middle of the market is barely flat
The $100k–$200k spend tier: what the data shows
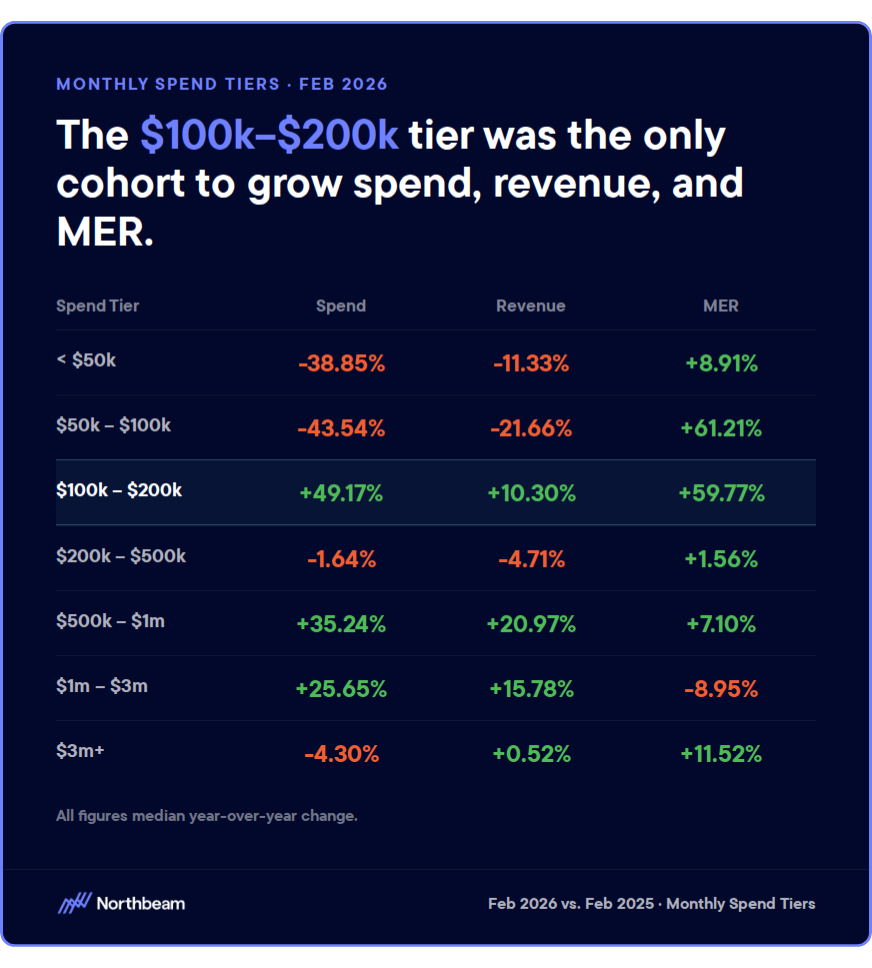
The performance profile of the $100k–$200k monthly spend tier in February 2026 is the clearest positive outlier in this dataset. Every other tier in the data traded one metric to improve another. This tier improved all three:
- Spend: median +49.17% YoY — a deliberate and substantial increase
- Revenue: median +10.30% YoY — real demand captured, not manufactured by discounting
- MER: median +59.77% YoY — efficiency improved alongside scale, not despite it
- 75th percentile MER: +97.68% — the top half of this tier very nearly doubled their marketing efficiency ratio year over year
No other spend cohort in February 2026 grew spend, grew revenue, and improved MER at the median level. The $100k–$200k tier achieved all three.
This combination matters because of what it rules out. An MER improvement driven purely by spend cuts is not a signal of efficiency; it is a signal of retreat. Several other tiers in this dataset improved MER by pulling spend back sharply. The $50k–$100k tier improved median MER by 61.21 percent while cutting spend 43.54 percent and losing 21.66 percent in revenue. That is cost-cutting dressed up as efficiency. The $100k–$200k tier improved MER while growing both spend and revenue, which means the underlying economics actually got better.
Where the efficiency advantage breaks down
The data does not support an argument that more Amazon spend is always better. The efficiency advantage visible in the $100k–$200k tier begins eroding almost immediately at higher spend levels. Moving up through the spend tiers tells a consistent story of compression:
- $200k–$500k: spend flat at -1.64%, revenue declined 4.71%, MER barely moved at +1.56%
- $500k–$1m: spend up 35.24%, revenue up 20.97%, but MER improvement compressed to just +7.10%
- $1m–$3m: spend up 25.65%, revenue up 15.78%, MER now negative at -8.95% — growth is happening but efficiency is deteriorating
- $3m+: spend cut 4.30%, revenue barely positive at +0.52% — scale without return
Efficiency peaks in the $100k–$200k monthly spend zone and degrades in both directions from it. Scaling spend past $200k per month into February produces incrementally worse returns at the median.
The pattern across tiers is consistent: efficiency peaks in the $100k–$200k zone and degrades in both directions from it. Below it, the $50k–$100k tier needed to retreat sharply to improve MER at all. Above it, scaling spend produces incrementally worse efficiency returns. This does not mean the $100k–$200k zone is the right target for every business. It means that in February 2026, this is where Amazon's auction dynamics, category demand, and budget scale appear to be most aligned.
What this means for March and Q2
February is structurally a soft demand month on Amazon outside of Valentine's Day categories. The fact that the $100k–$200k tier achieved meaningful efficiency gains in this environment is notable precisely because soft months tend to expose structural weaknesses in media strategy, not hide them. If the efficiency advantage in this tier holds into March, when broader category demand typically recovers, the returns could be significantly stronger.
Businesses currently sitting in the $50k–$100k monthly spend range should treat this data as directional evidence for a controlled scale-up. The move from sub-$100k to the $100k–$200k range is where the positive data sits. That scale-up should be staged, with MER tracked weekly rather than monthly, because the evidence for what happens above $200k per month is less encouraging.
Businesses already spending above $200k per month should audit their MER trend before increasing budgets further. The February data suggests that incremental spend in this range delivers incrementally weaker returns. If MER has b een declining month over month alongside spend increases, February's benchmark data suggests that trajectory is not an anomaly. It is the market reflecting back what scaling past the efficiency frontier looks like on Amazon right now.
What operators should do differently
If your Amazon monthly spend is below $100k and your category has meaningful March demand, the evidence supports a planned move toward the $100k–$200k range rather than waiting for a stronger seasonal window. The businesses achieving the best efficiency in February are not doing so in a favorable demand environment. They are doing it in a difficult one.
If your spend is above $200k per month, the question is not whether to scale further. The question is whether your current MER trajectory is consistent with the degradation pattern this data shows across higher spend tiers. February 2026 does not tell you to cut. It tells you to measure.
- Below $100k/month: treat March as the window to stage a controlled move into the $100k–$200k range; track MER weekly, not monthly, during the ramp
- At $100k–$200k/month: the data supports holding or cautiously increasing spend — you are in the efficiency-optimal zone; do not scale past $200k without a clear MER thesis
- Above $200k/month: audit your trailing MER trend before adding budget; if efficiency has been declining alongside spend increases, that trajectory is not seasonal noise — it is structural
- At $1m+/month: benchmark your own MER against the -8.95% median for your tier; if you are at or below that number, the next dollar of spend is unlikely to solve the problem

What is gross profit? Definition, formula, & examples

Revenue alone does not determine whether a business is healthy. A company can generate impressive sales and still struggle financially if the underlying costs of producing or delivering its products are too high.
Gross profit helps clarify this picture. It measures how much money remains after covering the direct costs required to deliver a product or service.
In this guide, we’ll explain what gross profit is, how to calculate gross profit, how it differs from net profit, and why it matters for marketers making growth and budget decisions. Understanding gross profit is essential for building sustainable, profitable growth.
What is gross profit?
Gross profit measures how much money a business keeps after paying the direct costs required to produce or deliver its product or service. It is one of the simplest and most important indicators of whether a company’s core operations are financially viable.
The key distinction is between revenue and profit. Revenue represents the total money generated from sales. Gross profit, by contrast, shows what remains after subtracting the cost of goods sold (COGS).
COGS includes the direct costs tied to delivering the product or service, such as materials, manufacturing, fulfillment, or service delivery labor.
Because it isolates production costs, gross profit acts as an early profitability filter. A company can generate strong revenue while still struggling financially if its direct costs are too high. Gross profit reveals whether the business model itself produces meaningful economic value before operating expenses like marketing, salaries, or rent are considered.
On financial statements, gross profit appears near the top of the income statement, directly below revenue and cost of goods sold. From there, operating expenses are subtracted to determine operating profit and eventually net profit.
For marketers and operators alike, gross profit provides a clear baseline for evaluating growth decisions.
The gross profit formula explained
The gross profit formula is straightforward:
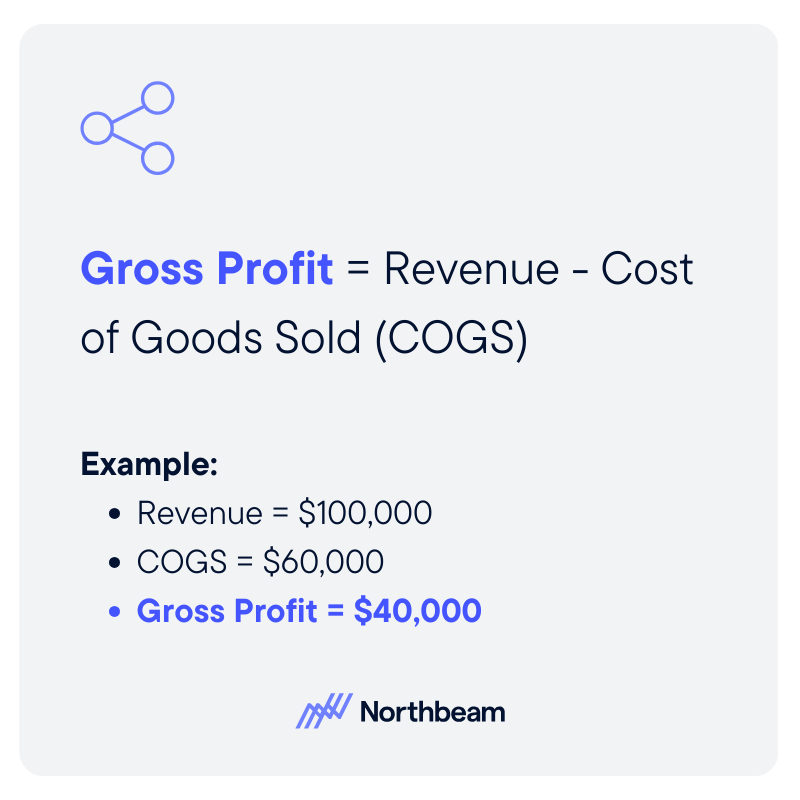
Gross Profit = Revenue – Cost of Goods Sold (COGS)
Revenue refers to the total income generated from selling products or services before any expenses are deducted. For example, if a company sells 1,000 units of a product at $50 each, the total revenue would be $50,000.
Cost of goods sold includes the direct costs required to produce or deliver those products or services:
- In a retail business, COGS might include manufacturing costs, wholesale purchase prices, packaging, and shipping.
- For a software company, COGS could include cloud infrastructure costs, payment processing fees, and customer support tied directly to delivering the service.
- In a service business, it might include the labor costs of employees who perform the service.
It is equally important to understand what does not count as COGS. Marketing expenses, office rent, executive salaries, and administrative overhead are typically classified as operating expenses rather than production costs. These costs affect overall profitability, but they are not included in the gross profit calculation.
For example, if a company generates $100,000 in revenue and spends $60,000 on cost of goods sold, the calculation would be:
Gross Profit = $100,000 – $60,000 = $40,000
That $40,000 represents the value remaining to cover operating expenses and generate profit.
Gross profit examples across business models
Gross profit works the same way across industries, but the types of costs included in COGS can vary significantly depending on the business model.
The examples below illustrate how gross profit appears in retail, SaaS, and service-based businesses, as well as how margins can differ across industries.
Retail Business (Physical Goods)
- Revenue: A clothing retailer sells 500 jackets at $120 each, generating $60,000 in revenue.
- COGS: The jackets cost $50 each from the manufacturer, for a total production cost of $25,000. Packaging and fulfillment add another $5,000.
- Gross profit: $60,000 – $30,000 = $30,000 gross profit.
Retail businesses typically have clear, product-level costs tied to inventory and fulfillment, which makes gross profit relatively straightforward to calculate.
SaaS or subscription business
- Revenue: A SaaS company generates $200,000 in monthly subscription revenue.
- COGS: Direct delivery costs include cloud hosting, customer support, and payment processing fees, totaling $50,000 per month.
- Gross profit: $200,000 – $50,000 = $150,000 gross profit.
Software businesses often have high gross margins because the cost of delivering additional users is relatively low once the platform is built.
Service business
- Revenue: A marketing agency generates $120,000 in project revenue in a month.
- COGS: The direct labor cost for the team delivering client work is $70,000.
- Gross profit: $120,000 – $70,000 = $50,000 gross profit.
In service businesses, labor is typically the primary component of COGS, making utilization and staffing efficiency key drivers of margin.
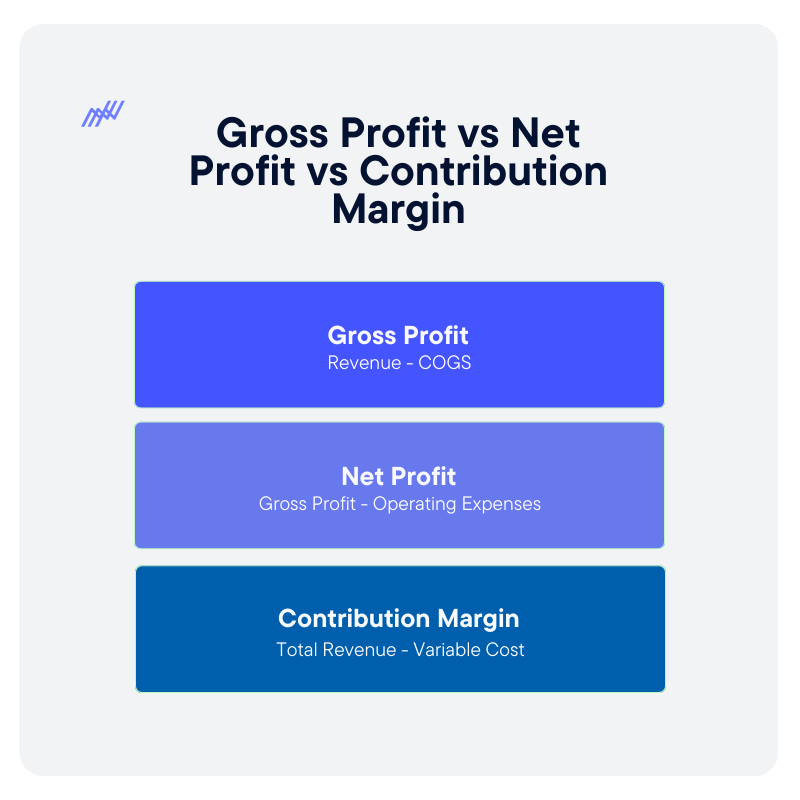
Gross Profit vs Net Profit vs Contribution Margin
Understanding gross profit becomes easier when it is compared with other common profitability metrics, particularly net profit and contribution margin. Each metric captures a different stage of how revenue turns into profit.
Gross profit
Gross profit measures the money remaining after subtracting cost of goods sold (COGS) from revenue. It focuses only on the direct costs required to produce or deliver a product or service.
Because it isolates these production costs, gross profit reveals whether the core business model generates value before broader operating expenses are considered.
Net profit
Net profit represents the final profit of the business after all expenses are deducted. In addition to COGS, this includes operating costs such as marketing, salaries, rent, software subscriptions, and administrative overhead.
Taxes and interest expenses are also typically included in the calculation. A company may report strong gross profit but still have weak net profit if operating expenses are too high.
Contribution margin
Contribution margin measures how much revenue remains after subtracting variable costs, which are expenses that scale directly with sales volume.
This metric is often used in pricing and unit economics analysis because it shows how much each additional sale contributes toward covering fixed costs and generating profit.
Why gross profit matters for marketing
Gross profit plays a critical role in determining how much a company can afford to spend on marketing while still growing sustainably.
One of the most important relationships is between gross profit and customer acquisition cost (CAC). Marketing investments are ultimately funded by the profit generated from each sale, so if the gross profit per customer is too small, even efficient marketing campaigns can struggle to generate meaningful returns.
Gross profit also helps establish media efficiency guardrails. Marketing teams often evaluate performance using metrics like cost per click or cost per acquisition, but these metrics only tell part of the story. Without understanding gross profit, it becomes difficult to determine how much acquisition cost the business can tolerate while maintaining healthy margins.
Pricing and discount strategies also directly influence gross profit. Promotions may increase conversion rates and revenue in the short term, but they can also reduce the profit available to support marketing spend.
Similarly, different products within a catalog may carry very different margins. Marketing campaigns that prioritize lower-margin products can generate impressive revenue while contributing less profit to the business.
For these reasons, revenue growth alone can be misleading. A company that increases sales without protecting its gross profit may ultimately destroy value rather than create it.
Aligning marketing decisions with gross profit ensures that growth strengthens, rather than weakens, the underlying economics of the business.
Common gross profit mistakes and misinterpretations
Even though gross profit is a straightforward metric, it can be misinterpreted or calculated incorrectly. These mistakes can lead to flawed conclusions about profitability and growth performance.
Misclassifying costs
Businesses sometimes include expenses like marketing spend, software subscriptions, or administrative salaries in COGS even though these are operating expenses. This distorts the gross profit calculation and makes it harder to evaluate the true profitability of the product or service.
The solution is to define COGS clearly and apply that definition consistently across reporting periods.
Ignoring variable cost shifts
Gross profit can change even when revenue stays constant because the underlying costs of production fluctuate. Supplier price increases, higher shipping costs, or infrastructure expenses can quietly reduce margins over time.
Monitoring changes in unit costs and regularly reviewing cost assumptions helps ensure that gross profit remains an accurate reflection of operational economics.
Comparing gross profit without context
Gross profit figures are sometimes compared across products, campaigns, or companies without considering differences in pricing, cost structures, or business models. A higher gross profit number does not necessarily mean better performance.
Evaluating gross profit alongside revenue scale, margins, and cost structures provides a more meaningful comparison.
Focusing only on gross margin percentage
Gross margin percentage is useful, but it does not tell the whole story. A business can have high margins but low overall revenue, resulting in limited total profit.
Combining gross margin analysis with total gross profit and unit economics provides a clearer view of financial performance.
Gross profit measurement & governance checklist
Tracking gross profit consistently requires more than a single calculation. Organizations need supporting metrics, diagnostic checks, and clear governance practices to ensure margin insights translate into better decisions.
KPIs to Monitor Alongside Gross Profit
- Gross margin percentage: Shows gross profit as a share of revenue, making it easier to compare profitability across products, time periods, and business units.
- Customer acquisition cost (CAC): Helps determine whether marketing spend is sustainable relative to the profit generated from new customers.
- Contribution margin: Highlights how much revenue remains after variable costs, providing additional context for pricing and unit economics decisions.
- Average order value (AOV): Indicates how much revenue each transaction generates, which can directly influence total gross profit.
Diagnostic checks
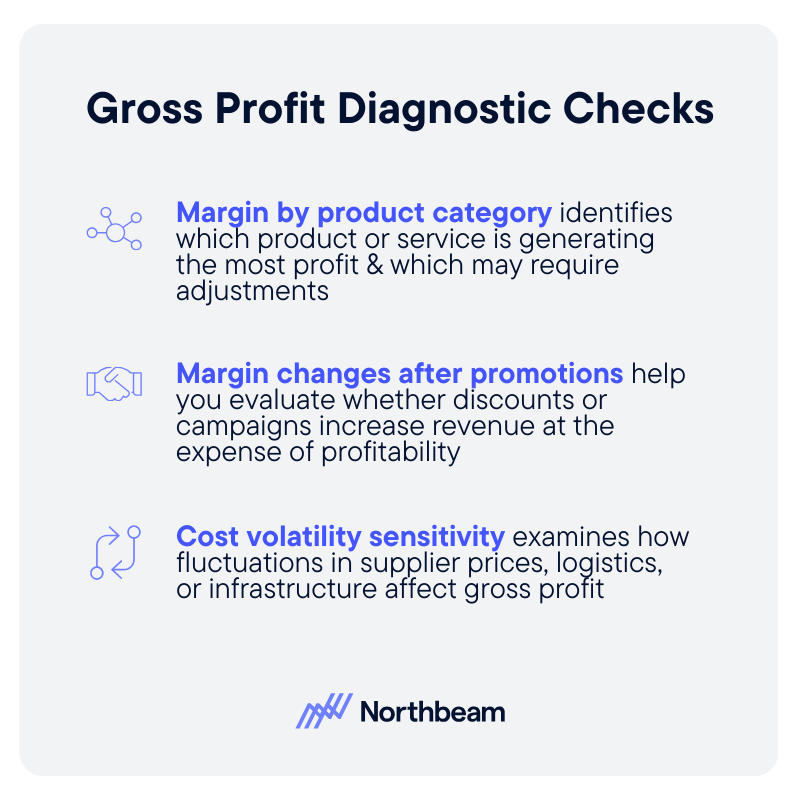
Margin by product category: Identifies which products or services generate the most profit and which may require pricing or cost adjustments.
- Margin changes after promotions: Evaluates whether discounts or campaigns increase revenue at the expense of profitability.
- Cost volatility sensitivity: Examines how fluctuations in supplier prices, logistics, or infrastructure costs affect gross profit.
Governance considerations
- Clear COGS definitions: Establish consistent rules for what expenses are included in cost of goods sold.
- Consistent reporting cadence: Track margins regularly so shifts in profitability are detected early.
- Alignment between marketing and finance: Ensure growth initiatives are evaluated against reliable margin data.
From revenue to real profitability
Gross profit shows how much value remains after the direct costs of producing or delivering a product or service are covered. Accurate classification of cost of goods sold is essential for making reliable margin decisions and understanding the true economics of the business.
For marketers, gross profit provides the guardrails for sustainable growth. Aligning acquisition spend with margin ensures campaigns generate real value, not just revenue. Protecting gross profit while scaling demand helps companies grow in a way that strengthens long-term profitability.

How to calculate marginal cost: Formula, examples, and calculator
Profitability decisions often hinge on a simple question: what does it cost to produce one more unit?
Marginal cost measures the incremental cost of increasing output, making it a critical input for pricing, production planning, and growth decisions.
This guide explains the marginal cost formula, walks through practical examples, highlights common calculation mistakes, and shows how to use a marginal cost calculator.
Used correctly, marginal cost is not just an accounting concept, but a practical decision tool for evaluating scale, pricing, and operational efficiency.
What is marginal cost in business and why does It matter
Marginal cost measures the additional cost required to produce one more unit of output. Instead of looking at total spending across all production, marginal cost focuses on the incremental change that occurs when production increases.
Understanding marginal cost requires distinguishing between fixed costs and variable costs:
- Fixed costs, such as rent, salaries, or equipment leases, remain constant regardless of how many units are produced in the short term.
- Variable costs, including raw materials, packaging, and fulfillment expenses, rise as production increases.
Marginal cost reflects how these costs change when output expands.
Because it isolates incremental change, marginal cost is especially useful for operational decision-making. It helps businesses evaluate whether increasing production will improve profitability, determine pricing floors, and assess the financial impact of scaling output.
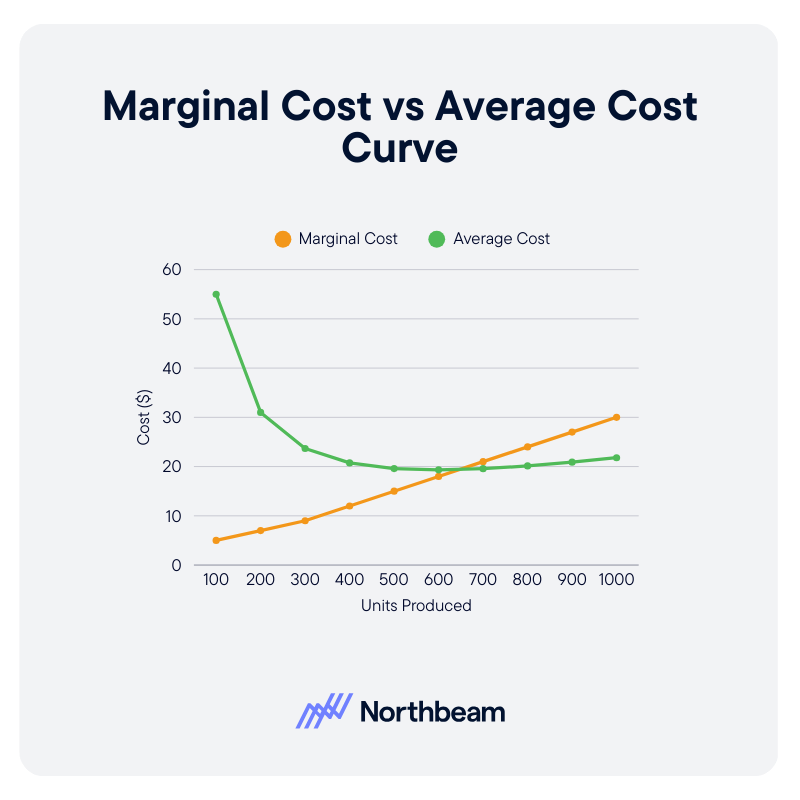
Marginal cost is often confused with average cost, but the two metrics answer different questions. Average cost divides total costs across all units produced, while marginal cost focuses specifically on the cost of producing the next unit.
Average costs decline over time as fixed costs are spread across more units. Marginal cost intersects average cost at the lowest point of the average cost curve, which is a standard economic relationship, before fixed costs start to increase to accommodate more production.
For pricing and production planning, marginal cost often provides the more actionable insight.
The marginal cost formula with examples
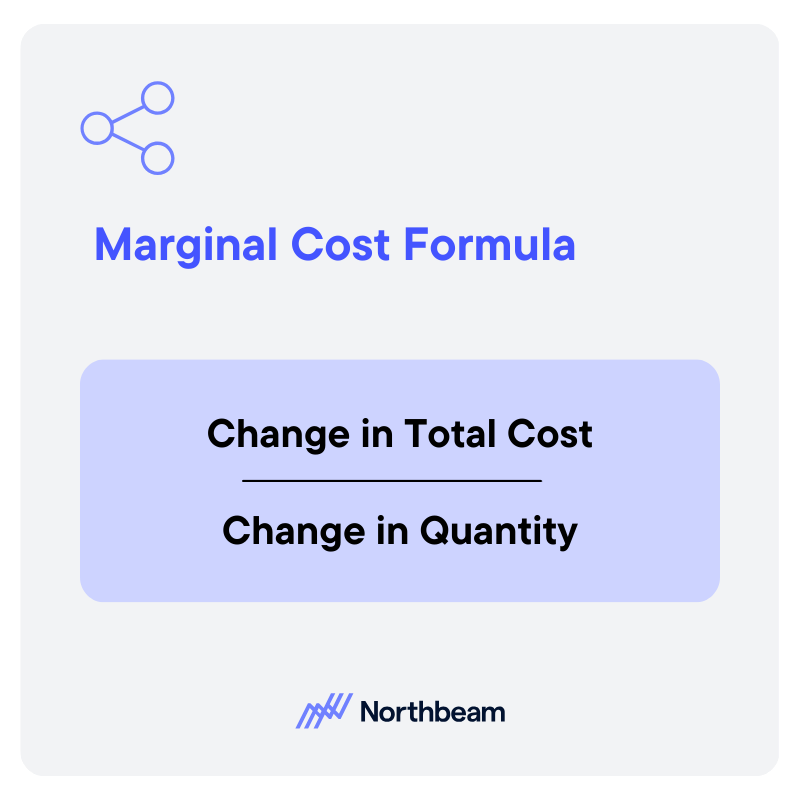
Here’s how to calculate marginal cost step by step:
Marginal Cost = Change in Total Cost ÷ Change in Quantity
At its core, this formula measures how much additional cost is incurred when output increases.
Change in total cost means the difference between the total cost at one production level and the total cost at a higher production level.
This should include any costs that actually change as production rises, such as raw materials, direct labor, packaging, or shipping.
Fixed costs usually remain unchanged in the short term, though they can shift at certain production thresholds.
Change in quantity refers to the difference in the number of units produced between those two output levels. For example, if production rises from 1,000 units to 1,200 units, the change in quantity is 200.
In many business contexts, production changes are discrete, meaning output rises in whole units or batches. In economics, marginal cost may also be discussed more continuously, as the cost of producing one additional unit at any point on the cost curve.
For most business applications, though, the practical approach is to calculate it across a real change in output.
For example, if total cost rises from $10,000 to $11,200 when production increases from 1,000 to 1,200 units, marginal cost is $1,200 ÷ 200 = $6 per unit.
Marginal cost examples across different business contexts
Marginal cost behaves differently depending on the type of business and its cost structure. Looking at examples across industries helps illustrate how the concept applies in practice.
Manufacturing
In manufacturing, marginal cost typically reflects the additional materials, labor, and energy required to produce more units.
For example, a furniture manufacturer may spend $50 on wood, hardware, and labor to produce each additional chair once the factory is already operating.
In this case, the marginal cost of one more chair is roughly $50, assuming no major capacity changes.
SaaS/Digital products
For SaaS and digital products, marginal cost is often extremely low. Once the software platform is built, the cost of adding another user might be limited to incremental cloud infrastructure, customer support, or payment processing fees.
If those additional costs total $0.30 per user, then the marginal cost of serving one more customer is about thirty cents.
Ecommerce
In e-commerce, marginal cost typically includes product cost, packaging, and fulfillment expenses. If an online retailer pays $15 for inventory and $4 for shipping and packaging, the marginal cost of fulfilling an additional order might be around $19.
Cost structure considerations
Cost structure also influences how marginal cost behaves.
Businesses with high fixed costs, such as software platforms or factories, often see marginal costs decline as production scales. In contrast, low fixed-cost businesses with high variable inputs may see marginal costs remain relatively stable as output increases.
How to use a marginal cost calculator
A marginal cost calculator can help quickly estimate the incremental cost of increasing production. To use one correctly, you need two core inputs:
- Total cost before the production change
- Total cost after the change
You also need the corresponding output levels for each scenario.
For example, if producing 1,000 units costs $10,000 and producing 1,200 units costs $11,200, the calculator will determine the marginal cost by dividing the change in cost by the change in quantity.
While calculators simplify the process, it is still helpful to understand the manual formula behind them.
In spreadsheets, the same calculation can be implemented with a simple formula:
(New Total Cost – Previous Total Cost) / (New Quantity – Previous Quantity).
This allows teams to model multiple scenarios and update assumptions quickly.
Marginal cost calculators can also be used in reverse. By estimating the marginal cost of producing additional units, businesses can approximate break-even thresholds or evaluate whether scaling production will improve profitability.
However, calculator outputs should always be interpreted carefully. Marginal cost reflects a specific production change, not a universal cost per unit. Capacity limits, input price fluctuations, and operational constraints can all shift the result.
Marginal cost calculator
Use the calculator below to estimate the incremental cost of increasing production. Enter the total cost and output level before and after a production change to quickly compute the marginal cost per additional unit.
Marginal cost and pricing decisions
Marginal cost plays an important role in pricing strategy, but it should be used as a decision input, not the only pricing rule. Understanding how incremental costs interact with margins, demand, and competitive dynamics helps businesses set sustainable prices.
Pricing floors and marginal cost
Marginal cost often serves as a practical pricing floor. Pricing below marginal cost means each additional sale increases losses because the revenue generated does not cover the incremental cost of producing that unit.
In most cases, businesses aim to price above marginal cost so that each additional unit contributes to covering fixed costs and generating profit.
Contribution margin considerations
Pricing decisions should also consider contribution margin, which is the difference between price and marginal cost. A healthy contribution margin ensures that each sale contributes toward fixed costs such as salaries, infrastructure, or rent.
For example, if a product sells for $20 and the marginal cost is $8, the contribution margin is $12. This margin is what allows the business to recover fixed costs and eventually generate profit.
Short-term vs long-term trade-offs
In some cases, businesses may temporarily price close to marginal cost. This can happen during promotions, market entry, or efforts to increase utilization of existing capacity.
However, sustained pricing near marginal cost can be risky if it does not cover fixed costs over time.
Risks of misusing marginal cost
Marginal cost alone should not determine pricing strategy. Competitive dynamics, customer demand, and brand positioning all influence what customers are willing to pay.
Over-relying on marginal cost can lead to underpricing products and leaving potential revenue on the table.
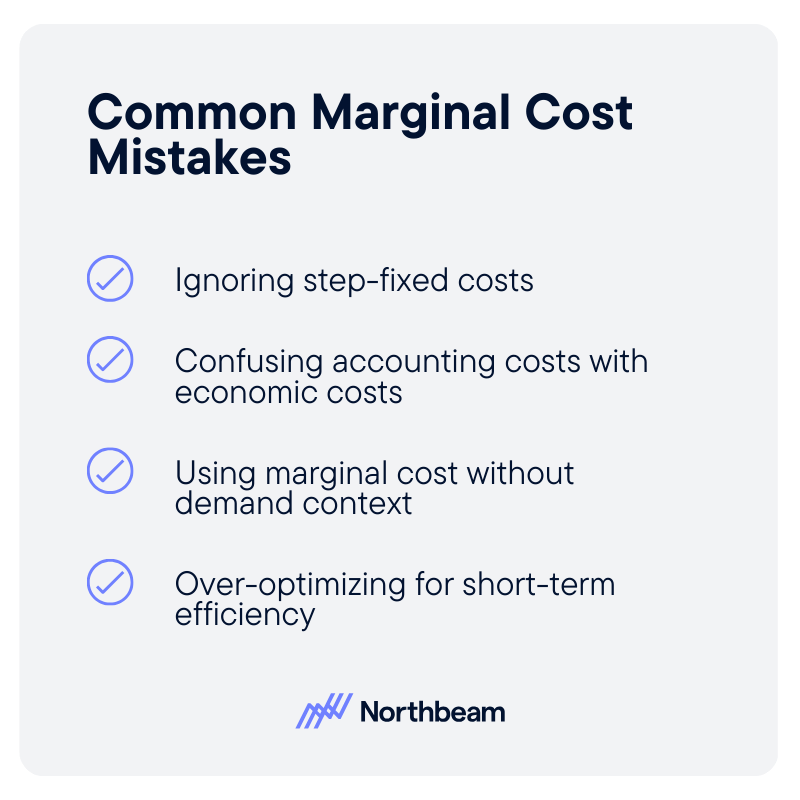
Common marginal cost mistakes
Marginal cost is a useful decision tool, but it is easy to misuse if the underlying assumptions are misunderstood. Several common pitfalls can lead to inaccurate calculations or poor business decisions.
Ignoring step-fixed costs
Many costs appear fixed until production crosses a certain threshold. For example, a factory may operate with one supervisor up to a certain output level, but adding a second production shift requires hiring another supervisor.
These step-fixed costs can cause marginal cost to jump suddenly when capacity limits are reached.
If these thresholds are ignored, marginal cost estimates may look artificially low and lead to overly aggressive pricing or expansion decisions.
Confusing accounting costs with economic costs
Accounting records typically capture explicit expenses such as materials, labor, and overhead. However, economic costs may also include opportunity costs, such as alternative uses of labor, equipment, or production capacity.
Relying solely on accounting costs can underestimate the true cost of producing additional units, especially in constrained environments.
Using marginal cost without demand context
Marginal cost helps explain the cost side of a decision, but it says nothing about customer demand or willingness to pay. A product priced slightly above marginal cost may still fail if the market will not support the price.
Pricing decisions should therefore consider both marginal cost and expected revenue dynamics.
Over-optimizing for short-term efficiency
Focusing too narrowly on marginal cost can encourage decisions that maximize short-term efficiency but undermine long-term strategy. For example, cutting service quality or delaying maintenance might temporarily reduce marginal costs while creating larger costs later.
Practical guardrails
To avoid these pitfalls, businesses should track marginal cost alongside other metrics such as contribution margin, capacity utilization, and demand signals.
Regular sensitivity analysis and cross-team alignment between finance and operations also help ensure marginal cost calculations remain realistic and actionable.
Marginal cost implementation plan
Applying marginal cost analysis consistently requires a clear process across finance and operations. A phased implementation helps organizations move from rough estimates to reliable decision support.
1. Audit cost structure
Start by identifying how costs behave across the business. Finance teams should separate fixed costs from variable costs and document how expenses change as production increases.
This step often involves reviewing accounting systems, ERP data, and operational records to ensure cost categories are accurate and consistently defined.
2. Establish baseline marginal cost
Once costs are categorized, teams can calculate a baseline marginal cost using recent production data. This involves comparing total costs at two different output levels and applying the marginal cost formula.
Documenting this methodology ensures that future calculations use the same assumptions and time windows.
3. Integrate into pricing and planning
With a baseline in place, marginal cost can be incorporated into pricing strategy, capacity planning, and financial forecasting.
Leadership and finance teams can use the metric to define pricing guardrails, evaluate scaling decisions, and model how production changes affect profitability.
4. Ongoing monitoring and refinement
Marginal cost is not static. As input prices, production volumes, or operational processes change, the calculation must be updated. Regular monitoring helps ensure models remain accurate and reflect real operating conditions.
Marginal cost as a decision tool
Marginal cost measures the incremental cost of producing one additional unit of output. Calculating it accurately requires clear cost categorization and consistent tracking of production levels.
When applied correctly, marginal cost helps businesses understand how production changes affect profitability. It informs pricing floors, scaling decisions, and operational planning.
And used thoughtfully alongside metrics like contribution margin and capacity utilization, marginal cost becomes a practical tool for smarter financial and strategic decision-making.


Product

RESOURCES
Support
Legal
Follow us
.svg)
