


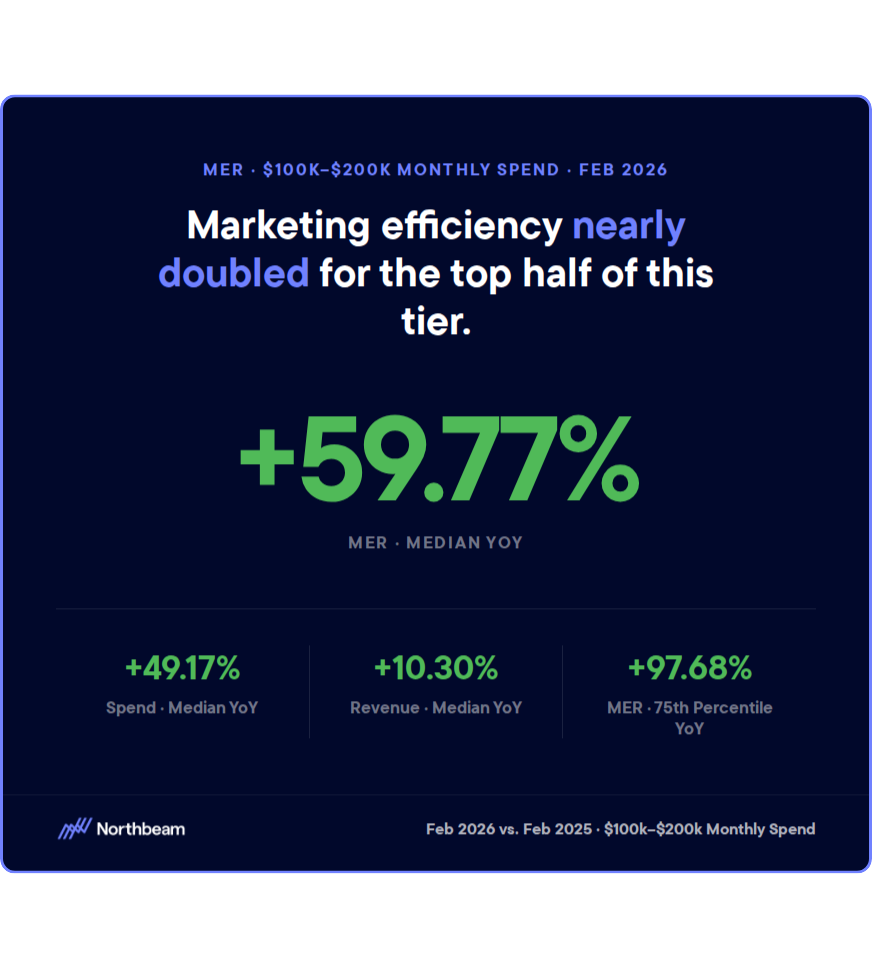
In February 2026, one Amazon spend tier separated itself from the rest of the market: businesses spending between $100,000 and $200,000 per month on the platform grew median spend by 49.17 percent year over year, grew median revenue by 10.30 percent, and improved median MER by 59.77 percent. No other spend cohort in this dataset achieved all three simultaneously. Most achieved none.
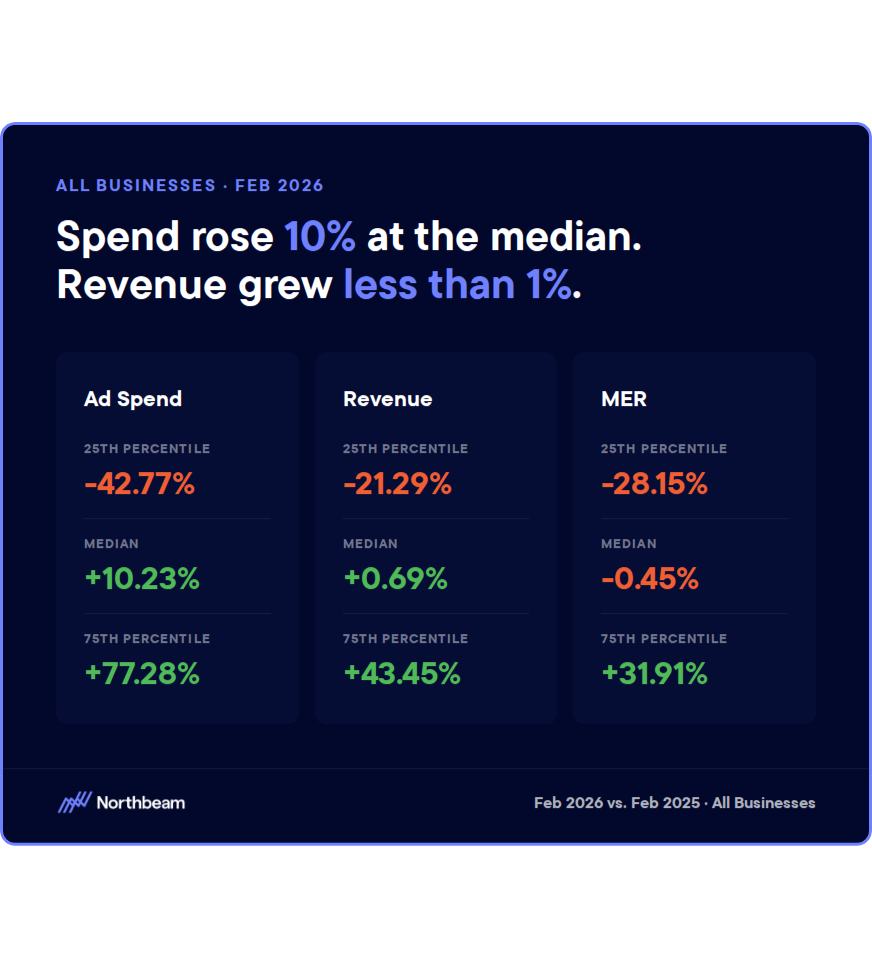
Across the broader Amazon market in February 2026, the picture is one of spend outrunning return. Median spend grew 10.23 percent year over year while median revenue grew just 0.69 percent and median MER declined 0.45 percent. That is the backdrop against which the $100k–$200k tier stands out: not just as a relative winner, but as a genuine anomaly worth understanding.
February 2026: aggregate Amazon performance
At the median across all businesses in this dataset, February delivered a familiar Q1 pattern: flat revenue, rising spend, and pressure on efficiency. Median revenue growth of 0.69 percent year over year does not justify a 10.23 percent increase in spend. The gap between those two numbers points to either rising CPCs, declining conversion rates, or both. The aggregate MER figure of -0.45 percent confirms that, at the market level, February 2026 slightly underperformed the same month in the prior year on efficiency terms.
The 25th to 75th percentile spread makes the bifurcation visible. February is not a month where the median operator is having a clean experience. The question is which cohorts are escaping the aggregate weakness, and why.
- Spend: 25th percentile -42.77% to 75th percentile +77.28% — a 120 percentage point spread
- Revenue: 25th percentile -21.29% to 75th percentile +43.45%
- MER: 25th percentile -28.15% to 75th percentile +31.91% — the middle of the market is barely flat
The $100k–$200k spend tier: what the data shows
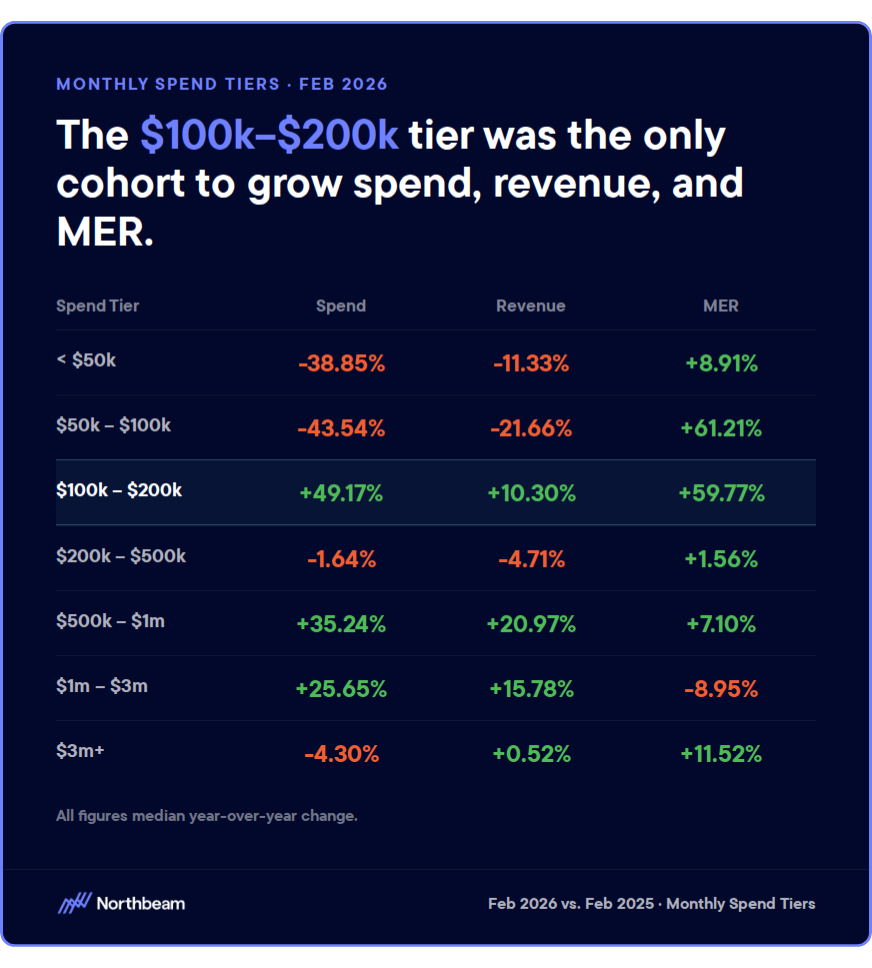
The performance profile of the $100k–$200k monthly spend tier in February 2026 is the clearest positive outlier in this dataset. Every other tier in the data traded one metric to improve another. This tier improved all three:
- Spend: median +49.17% YoY — a deliberate and substantial increase
- Revenue: median +10.30% YoY — real demand captured, not manufactured by discounting
- MER: median +59.77% YoY — efficiency improved alongside scale, not despite it
- 75th percentile MER: +97.68% — the top half of this tier very nearly doubled their marketing efficiency ratio year over year
No other spend cohort in February 2026 grew spend, grew revenue, and improved MER at the median level. The $100k–$200k tier achieved all three.
This combination matters because of what it rules out. An MER improvement driven purely by spend cuts is not a signal of efficiency; it is a signal of retreat. Several other tiers in this dataset improved MER by pulling spend back sharply. The $50k–$100k tier improved median MER by 61.21 percent while cutting spend 43.54 percent and losing 21.66 percent in revenue. That is cost-cutting dressed up as efficiency. The $100k–$200k tier improved MER while growing both spend and revenue, which means the underlying economics actually got better.
Where the efficiency advantage breaks down
The data does not support an argument that more Amazon spend is always better. The efficiency advantage visible in the $100k–$200k tier begins eroding almost immediately at higher spend levels. Moving up through the spend tiers tells a consistent story of compression:
- $200k–$500k: spend flat at -1.64%, revenue declined 4.71%, MER barely moved at +1.56%
- $500k–$1m: spend up 35.24%, revenue up 20.97%, but MER improvement compressed to just +7.10%
- $1m–$3m: spend up 25.65%, revenue up 15.78%, MER now negative at -8.95% — growth is happening but efficiency is deteriorating
- $3m+: spend cut 4.30%, revenue barely positive at +0.52% — scale without return
Efficiency peaks in the $100k–$200k monthly spend zone and degrades in both directions from it. Scaling spend past $200k per month into February produces incrementally worse returns at the median.
The pattern across tiers is consistent: efficiency peaks in the $100k–$200k zone and degrades in both directions from it. Below it, the $50k–$100k tier needed to retreat sharply to improve MER at all. Above it, scaling spend produces incrementally worse efficiency returns. This does not mean the $100k–$200k zone is the right target for every business. It means that in February 2026, this is where Amazon's auction dynamics, category demand, and budget scale appear to be most aligned.
What this means for March and Q2
February is structurally a soft demand month on Amazon outside of Valentine's Day categories. The fact that the $100k–$200k tier achieved meaningful efficiency gains in this environment is notable precisely because soft months tend to expose structural weaknesses in media strategy, not hide them. If the efficiency advantage in this tier holds into March, when broader category demand typically recovers, the returns could be significantly stronger.
Businesses currently sitting in the $50k–$100k monthly spend range should treat this data as directional evidence for a controlled scale-up. The move from sub-$100k to the $100k–$200k range is where the positive data sits. That scale-up should be staged, with MER tracked weekly rather than monthly, because the evidence for what happens above $200k per month is less encouraging.
Businesses already spending above $200k per month should audit their MER trend before increasing budgets further. The February data suggests that incremental spend in this range delivers incrementally weaker returns. If MER has b een declining month over month alongside spend increases, February's benchmark data suggests that trajectory is not an anomaly. It is the market reflecting back what scaling past the efficiency frontier looks like on Amazon right now.
What operators should do differently
If your Amazon monthly spend is below $100k and your category has meaningful March demand, the evidence supports a planned move toward the $100k–$200k range rather than waiting for a stronger seasonal window. The businesses achieving the best efficiency in February are not doing so in a favorable demand environment. They are doing it in a difficult one.
If your spend is above $200k per month, the question is not whether to scale further. The question is whether your current MER trajectory is consistent with the degradation pattern this data shows across higher spend tiers. February 2026 does not tell you to cut. It tells you to measure.
- Below $100k/month: treat March as the window to stage a controlled move into the $100k–$200k range; track MER weekly, not monthly, during the ramp
- At $100k–$200k/month: the data supports holding or cautiously increasing spend — you are in the efficiency-optimal zone; do not scale past $200k without a clear MER thesis
- Above $200k/month: audit your trailing MER trend before adding budget; if efficiency has been declining alongside spend increases, that trajectory is not seasonal noise — it is structural
- At $1m+/month: benchmark your own MER against the -8.95% median for your tier; if you are at or below that number, the next dollar of spend is unlikely to solve the problem


.avif)


%25201.avif)


.avif)


.svg)
