


A newsletter for modern marketers.

TRUSTED BY THE WORLD'S SMARTEST MARKETERS


Free ad performance benchmarks every week.
Live webinars and strategy sessions with industry leaders.
Watch all previous episodes on our YouTube channel.
Insider strategies from the smartest brands in ecommerce.
SEE LATEST POSTS:

The Cost Of Growth: What 2025 Teaches DTC Businesses About Unit Economics In 2026

In 2025, ecommerce finally felt like growth mode again. Across Northbeam’s dataset, businesses increased ad spend and saw higher topline revenue year over year. On average, advertisers spent roughly 15% more on ads and generated a similar 14% lift in revenue, while the median business posted mid single digit gains on both lines.
The catch was what it cost to produce that growth. Marketing efficiency ratios (MER) softened and first time customer acquisition costs climbed. Median MER fell just over two percentage points, and median first time CAC was up nearly 9%, showing that incremental demand became more expensive to capture.
That is the core tension carrying into 2026: you could grow in 2025, but you probably did it with weaker unit economics. For some operators, that tradeoff was intentional and strategic. For others, it was a slow drift into paying more to stand still.
In 2026, the question is no longer whether growth is available. It is whether you can pursue it without eroding the economics that keep the business alive.
Download the full Northbeam 2025 data report.
This article reframes the key 2025 findings for a 2026 plan:
- What actually went wrong in 2025 from a unit economics standpoint
- How performance differed by company size and why that matters now
- The structural forces that pushed costs up even as revenue rose
- Concrete changes to make in 2026 if you want growth and durability
What “The Cost Of Growth” Really Means
Before digging into segments, it helps to reset the vocabulary you should be using to run 2026.
- MER (marketing efficiency ratio): Total revenue divided by total marketing spend. This is your blended, all in efficiency signal.
- First Time MER: First time customer revenue divided by total marketing spend. This isolates how efficiently you are acquiring new customers.
- CAC (customer acquisition cost): Total acquisition spend divided by the number of new customers.
On all three measures, 2025 was a step backward:
- Blended MER ticked down even as revenue rose.
- First time MER deteriorated faster than blended, which means acquisition was the main pressure point.
- First time CAC moved up meaningfully for the median business, and conversion rates declined, a sign that traffic quality worsened and fewer visits were truly net new.
So when we talk about “the cost of growth” in 2026, we are not being metaphorical. In 2025, businesses had to accept worse economics on each incremental dollar of new revenue.
This is the baseline to plan against now.
Who “Won” 2025 And What That Implies For 2026 By Size Band
The size breakdown makes the 2025 story much sharper and should directly shape your 2026 expectations.

Sub-$5M: Survival Mode To Discipline
Businesses under $5M in annual revenue had the roughest year:
- Median spend crept up only slightly, but median revenue actually declined.
- Both total and first time revenue fell, pointing to a cohort that could not deploy enough budget or convert it efficiently enough to keep up.
For these businesses, 2025 was less about “pay to grow” and more about pay more just to hang on. They prioritized cash preservation and margin protection rather than aggressive expansion.
In 2026, this segment should not pretend that a softer market will save them. The playbook is discipline: narrow guardrails on MER and CAC, simple attribution, and clear rules for when to pull back rather than chasing headline growth.
$5M–$20M: Comfortable But Fragile
In the $5M–$20M bands, the picture was more nuanced:
- Median spend and revenue both rose, with especially solid gains in the $10M–$20M tier.
- MER and CAC moved the wrong way, indicating that many businesses traded efficiency for modest growth.
This is the classic “comfortable but fragile” middle: enough budget to feel auction pressure and creative fatigue, but not enough operational scale to absorb mistakes or massively out-innovate the market.
In 2026, this tier must decide whether to behave like sub-$5M survivalists or $20M–$50M operators. Continuing to pay slightly more each quarter for slightly more revenue is how you end up boxed in by cash constraints and rising CAC.
$20M–$50M: Steady, Broad-Based Growth
The $20M–$50M cohort was one of the few genuine bright spots.
- Median stats showed spend and revenue moving up together, including first-time revenue.
- That suggests these businesses added volume without over relying on existing customers.
Even here, first time CAC and first time MER generally tightened. This group did not escape the 2025 acquisition environment. They simply managed it better than most by pairing scale with more disciplined guardrails.
In 2026, this tier is best positioned to compound if they protect their balance between topline and unit economics.
$50M+ And Enterprise: Deliberate Tradeoffs
At the top end, $50M+ businesses flipped from defensive to offensive:
- Median spend in the $50M–$100M and $100M+ bands climbed by roughly 18–23%, with revenue up in the mid teens.
- As we moved up the ladder, there was spend, more revenue, and higher first time CAC. The largest businesses were explicitly willing to trade efficiency for market share.
Upper mid and enterprise operators turned 2025 into a genuine step change year. Healthy fundamentals, well built out systems, and larger budgets helped them absorb the volatility that comes with algorithm driven advertising.
Why Unit Economics Deteriorated Even As Revenue Grew
Several overlapping forces drove the 2025 efficiency squeeze and will continue to matter in 2026.
1. Creative Fatigue And The Cost Of Staying In The Game
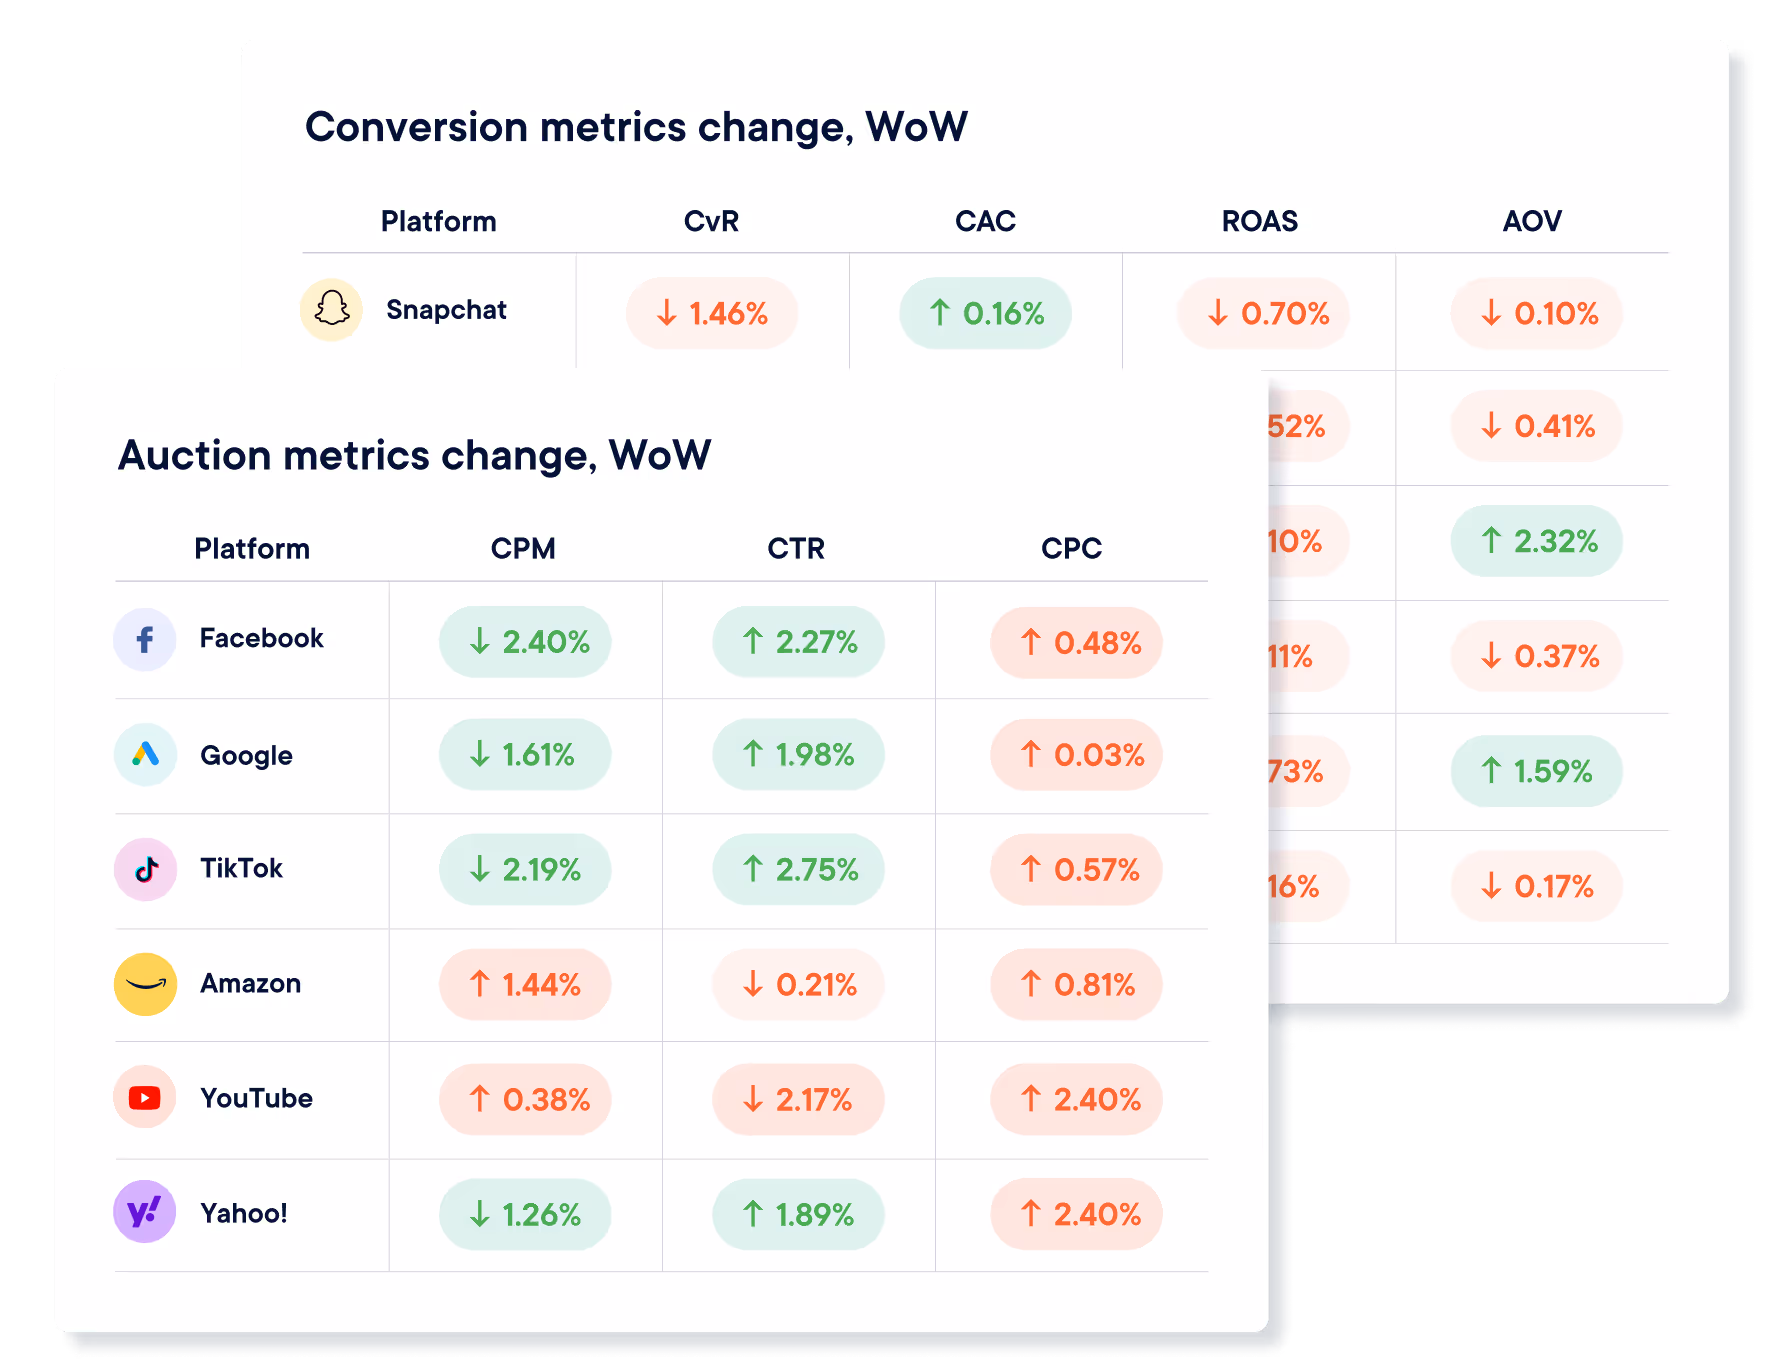
Across Meta, TikTok, Axon, YouTube, Pinterest, and Snap, there was a consistent relationship:
- As businesses moved into higher monthly spend bands, they launched dramatically more ads per month.
The platforms that drove growth in 2025 also demanded much higher creative velocity. For businesses that did not increase output at the same pace, creative fatigue showed up as rising CAC and sliding conversion.
That is another hidden cost of growth: systems, production, and internal operations that need to scale alongside budget and often do not.
2. Auction Pressure And More Low Intent Traffic
Across the dataset:
- First-time CAC increased.
- Blended and first time MER declined.
- Conversion rates fell.
That combination rarely happens by accident. It reflects two trends you should assume will still be in play this year:
- More businesses pushed back into growth mode, putting more budget into the same auctions and bidding up CPMs.
- A larger share of traffic was low intent or repeat. New visit percentage went down even as spend went up.
Net result: paying more per click to attract visitors who were less likely to convert and less likely to be truly net new. In 2026, ignoring new visit percentage is one of the fastest ways to quietly wreck your funnel.
3. Category Level “Growth At Any Cost”

Industry rollups showed how some verticals leaned into expensive growth:
- Sporting Goods and Fitness ramped spend and delivered some of the strongest median revenue gains, but median first time CAC jumped and first time MER fell, especially in the back half of the year.
- Technology businesses increased spend fastest of all, with big revenue gains and some of the steepest increases in CAC and declines in first time MER, particularly late in the year.
These are textbook examples of deliberately paying more per customer to secure category share. In 2026, treat these as upper bound scenarios when you model your own tolerance for CAC and MER deterioration.
For an industry-by-industry breakdown of the 2025 data, see my colleague CJ Hunter’s recent article.
4. Calendar Spikes That Loaded In Fragile Cohorts
Viewed month by month, 2025 looked less like a smooth climb and more like a series of cliffs:
- Median revenue growth was positive in most months.
- New customer revenue lagged or went negative in many of those same periods.
- Only a few months were true “pockets of efficient acquisition” where topline and first time performance improved together.
Q4 was especially revealing. Revenue spiked around peak promo moments, but in several categories first time MER and first time revenue deteriorated sharply in November and December, which implies a lot of holiday wins came from expensive, discount sensitive new cohorts.
In 2026, that pattern should inform when you are willing to pay up and what kind of cohorts you are willing to load during those windows.
How To Grow In 2026 Without Breaking Unit Economics
The final step is turning those 2025 lessons into a 2026 operating checklist.
1. Turn 2025 Numbers Into Explicit Guardrails
Set MER floors and CAC ceilings for 2026 that reflect what you learned last year:
- Decide how low MER can go across blended, first time, and returning revenue.
- Define CAC caps by product line, price point, and geography instead of relying on a single blended number. Different AOV bands live in very different CAC realities.
- Make these thresholds visible in daily and weekly views, not just in end of month recaps.
2. Separate Blended And New Customer Performance Everywhere
Returning customers repeatedly masked weaker acquisition economics in 2025. Fix that now:
- Report first time MER and first time CAC as first class KPIs.
- Investigate any period where revenue is growing but first time MER is slipping. Growth that rests on deteriorating new customer economics is not durable.
3. Benchmark By Size And Industry Cohort
Stop grading yourself against global averages:
- Compare your curves to businesses of similar revenue scale.
- Anchor your calendar and channel strategy to the shape of your category, whether that is resolution heavy Q1 in Health and Wellness or tight spring and summer efficiency windows in Fashion and Sporting Goods.
4. Scale Creative Systems Before Budgets
Treat creative capacity as a hard constraint:
- Commit to a minimum cadence of new concepts based on your spend band, calibrated to how many tests you can afford without crushing blended efficiency.
- Budget for the people and partners required to keep that cadence realistic.
- Use a measurement source of truth to decide which creative ideas actually move MER and CAC, not just in platform ROAS.
The 2026 Mindset Shift: From “Can We Grow” To “Can We Afford This Growth”
The 2025 data makes one thing clear: growth is no longer the scarce resource. Profitable growth is.
Businesses in the dataset proved they could grow spend and revenue. On average, they did exactly that. But the typical operator did it while accepting worse efficiency, more expensive new customers, and softer traffic quality.
So the real 2026 question is:
What does each additional dollar of growth actually cost you, and are you comfortable with that price
If 2025 was your “growth returned, but not on easy terms” year, let 2026 be the year you tighten guardrails, rebuild acquisition economics, and turn growth from something you buy into something your system can earn repeatably, at a price that keeps the business healthy enough to win your category over the long run.

How to Measure Content Marketing ROI (and Why Marketers Struggle with It)

Content is one of the most trusted marketing channels and one of the hardest to measure. It influences decisions over time, across channels, and rarely converts in a single step.
This article breaks down why content measurement falls short, what ROI actually means in a content context, and how teams can build a more credible measurement system.
What Content Marketing Measurement Really Means
Content marketing measurement is often confused with content reporting, but they are not the same thing. Reporting tells you what happened. Measurement helps you understand why it happened and what to do next.
Pageviews, clicks, and downloads are reports. Insight comes from connecting those signals to decisions, outcomes, and trade-offs.
One reason content marketing measurement ROI is so hard to pin down is that teams mix three different types of metrics:
- Activity metrics describe output, such as how much content was published
- Performance metrics show engagement, such as time on page, scroll depth, or return visits
- Business outcomes reflect downstream impact, like pipeline influence, conversion lift, or retention.
None of these layers is unimportant, but problems arise when activity or content performance metrics are treated as proof of ROI on their own.
Content rarely drives immediate conversion, especially in B2B or complex buying cycles. Its value compounds over time, shaping awareness, credibility, and consideration long before a buyer fills out a form or talks to sales.
Good content measurement accounts for both short-term and long-term value. A single asset may generate quick engagement, while also supporting future conversions weeks or months later. In this way, content works across the full funnel, from discovery to retention.
Measuring it well means evaluating contribution at each stage, not forcing it into a last-click box it was never meant to fit.
Why Marketers Struggle to Measure Content Marketing ROI
Content marketing measurement breaks down because content does not behave like most performance channels. Its impact is distributed, delayed, and shared across systems that were never designed to tell a single, simple story.
Content Rarely Drives Immediate Conversion
Most content is consumed long before a buyer is ready to act. Educational articles, guides, and thought leadership build familiarity and trust, but they are rarely the final step before conversion. When teams expect direct revenue attribution, content appears to underperform.
Multi-Touch Journeys Obscure Causality
Buyers encounter many pieces of content across channels. By the time a conversion happens, isolating the influence of any single asset becomes difficult. Attribution models struggle to reflect how content actually shapes decisions.
Inconsistent Tagging and Attribution Windows
Content measurement depends on clean taxonomy and consistent tracking. In reality, tagging varies by team, attribution windows are arbitrary, and historical data is often incomplete. This creates gaps that undermine confidence in the results.
Siloed Tools and Ownership Across Teams
Content lives in CMSs, content marketing analytics platforms, marketing automation tools, and CRMs. When ownership is fragmented, no one is responsible for connecting engagement to downstream outcomes.
Pressure to Prove Value Quickly
Leadership often wants fast proof of impact. This pushes teams toward shallow metrics that are easy to report but weak indicators of business value.
The Consequences of Poor Measurement
When content appears ineffective, teams either underinvest or optimize for the wrong signals. Both outcomes limit long-term growth and learning.
Core Metrics to Track at Each Stage of the Funnel
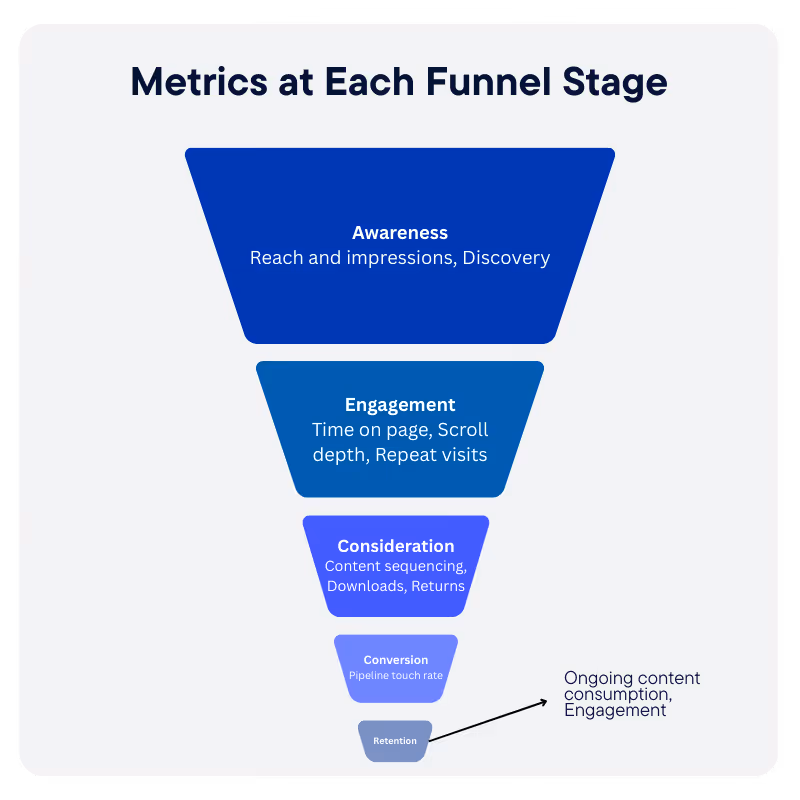
Effective content measurement starts with recognizing that no single metric tells the whole story. Content plays different roles at different stages of the funnel, and the metrics that matter should reflect those roles rather than forcing every asset to justify itself in revenue terms.
Awareness Metrics
At the top of the funnel, content supports discovery and visibility. Useful signals include:
- Reach and impressions, to understand how often content is surfaced.
- Assisted discovery, such as first-touch or early-touch appearances in buyer journeys.
Engagement Metrics
Engagement shows whether content is earning attention once discovered. Common indicators include:
- Time on page and scroll depth, to assess consumption quality.
- Repeat visits, which suggest sustained interest.
Consideration Metrics
As buyers evaluate options, content helps them progress and compare. Signals to track include:
- Content sequencing, or movement between related assets.
- Downloads and return frequency, which indicate deeper evaluation behavior.
Conversion Influence Metrics
Content often contributes indirectly to conversion. Helpful measures include:
- Assisted conversions, showing content presence in successful journeys.
- Pipeline touch rate, capturing how often content appears before revenue events.
Retention and Expansion Signals
Post-conversion content usage can support long-term value. Look for:
- Ongoing content consumption by existing customers.
- Engagement with educational or enablement assets tied to adoption.
The goal is not to eliminate leading indicators, but to interpret them in context and connect them to downstream outcomes over time.
Attribution and Contribution Models for Content
Attribution is where many content measurement efforts break down. Traditional models were designed for channels that drive immediate action, not for assets that influence decisions gradually and in combination with other touchpoints.
Why Last-Click Fails for Content
Last-click attribution assigns all credit to the final interaction before conversion. For content, this almost always misrepresents reality.
Educational articles, guides, and thought leadership tend to appear early or mid-journey, long before a buyer takes action. When last-click is the default, content appears ineffective even when it plays a meaningful role.
Multi-Touch Attribution for Content Influence
Multi-touch attribution distributes credit across multiple interactions in a buyer journey. For content, this approach better reflects how influence accumulates over time. It help teams see patterns in how content supports progression rather than expecting direct conversion.
Position-Based and Time-Decay Approaches
Position-based models assign more weight to early and late touches, acknowledging both discovery and conversion moments.
Time-decay models prioritize interactions closer to conversion while still recognizing earlier influence.
Both approaches are useful for content because they avoid the extremes of all-or-nothing credit.
Content Grouping and Asset-Level Rollups
Evaluating individual assets in isolation often produces noisy results. Grouping content by theme, audience, or funnel stage allows teams to assess performance at a level that supports decision-making.
When Directional Insight Is Sufficient
Content attribution rarely delivers precision. The goal is not perfect accounting, but informed direction.
When models consistently show which content types and themes contribute to successful journeys, teams have enough insight to prioritize investment and improve performance over time.
Building a Content Marketing Measurement Framework That Scales

A scalable content measurement framework focuses less on perfect data and more on consistency, clarity, and repeatable decision-making. The goal is to create a system teams can maintain over time as content volume and complexity grow.
1. Define Content Objectives by Audience and Stage
Measurement should start with clear objectives tied to who the content is for and where it fits in the funnel. Different audiences and stages require different success criteria, and alignment here prevents misinterpretation later.
2. Standardize Taxonomy, Tagging, and Naming
Consistent taxonomy is the foundation of reliable measurement. Standard naming conventions, tags, and metadata ensure content can be grouped, compared, and analyzed without manual cleanup.
3. Align Metrics to Decisions, Not Dashboards
Metrics should exist to inform action. Each tracked signal should map to a decision, such as where to invest, what to optimize, or what to retire, rather than filling space in a report.
4. Establish Review Cadence and Learning Loops
Regular reviews turn data into insight. A defined cadence helps teams identify patterns, test changes, and apply learnings across future content.
5. Document Assumptions and Limitations
No measurement system is perfect. Documenting assumptions, gaps, and known limitations for the next iteration builds trust and prevents overconfidence in the numbers.
Common Content Measurement Mistakes and How to Fix Them
The following content measurement mistakes are common, understandable, and fixable with a few structural changes.
Over-Optimizing for Clicks and Views
Mistake:
- Clicks and pageviews are easy to track and easy to report.
- They are often treated as success metrics, even when they do not reflect business impact.
- This pushes teams toward headline optimization rather than value creation.
Fix:
- Treat clicks and views as entry signals, not outcomes.
- Pair engagement metrics with downstream indicators such as assisted conversions or return visits.
- Evaluate performance trends over time instead of optimizing for single-asset spikes.
Treating All Content Equally
Mistake:
- All assets are measured against the same KPIs regardless of audience, purpose, or funnel stage.
- This makes high-value, early-stage content look weak and low-effort assets look successful.
Fix:
- Define success criteria by content type and funnel stage.
- Group assets by theme or objective before evaluating performance.
- Compare like with like rather than ranking everything on a single scale.
Content Marketing Attribution Challenges
Mistake:
- Content influence often appears weeks or months after publication.
- Short measurement windows miss compounding effects and long-tail value.
Fix:
- Extend attribution and evaluation windows for evergreen content.
- Track performance at multiple time horizons rather than single snapshots.
- Revisit older assets as part of regular reviews.
Failing to Connect Content to Downstream Systems
Mistake:
- Content engagement lives in web analytics, while revenue lives in CRM systems.
- Without integration, content impact remains anecdotal.
Fix:
- Connect content data to marketing automation and CRM platforms.
- Track content touches within buyer and customer journeys.
- Focus on influence patterns rather than perfect attribution.
Content Marketing Measurement Governance
Strong content measurement requires ongoing governance, not just one-time setup. Without guardrails, even well-designed frameworks degrade as content volume grows, teams change, and tools evolve.
Diagnostic checks help teams assess whether their measurement system is working as intended:
- Tracking time-to-impact by content type clarifies how long different assets typically take to influence outcomes
- Evaluating influence across multiple touches helps confirm that content is showing up throughout buyer journeys rather than clustering in a single stage
- Monitoring channel overlap and duplication prevents double counting and reveals where content may be competing with itself for credit.
Governance also requires clear ownership and shared rules. Teams should agree on who is responsible for content measurement, how attribution logic and windows are defined, and when those assumptions should be revisited.
Regular audits of tagging, taxonomy, and data quality help maintain confidence in the insights generated and prevent small inconsistencies from undermining long-term decision-making.
Content Marketing Measurement Tools
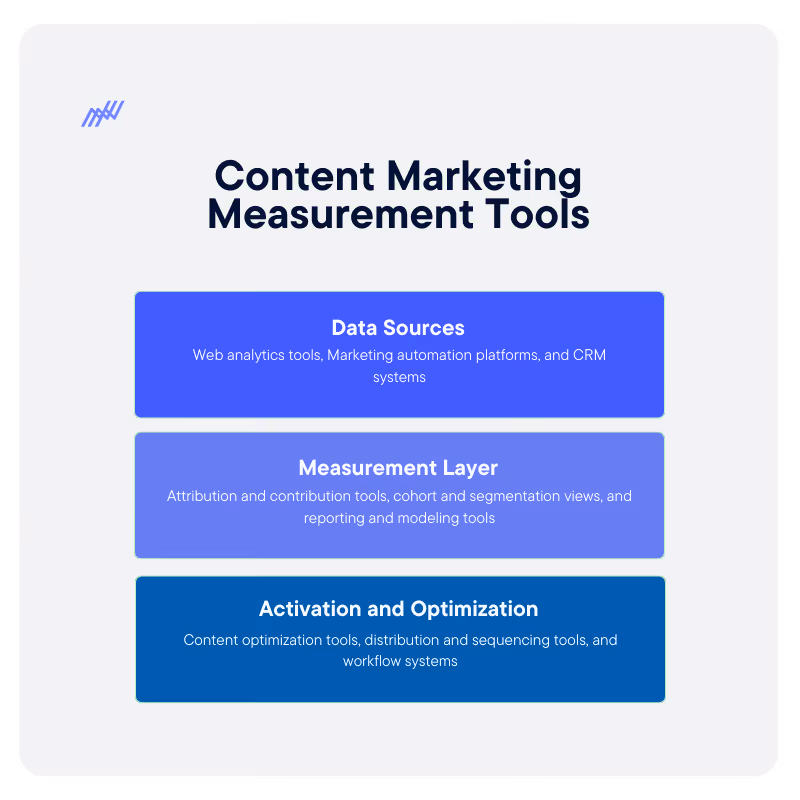
Effective content measurement does not depend on a single platform, but on how different tools work together across the measurement lifecycle.
Data Sources
These systems capture the raw signals that content measurement relies on:
- Web analytics tools to track pageviews, engagement, navigation paths, and on-site behavior.
- Marketing automation platforms to record content interactions tied to known leads and accounts.
- CRM systems to connect content exposure to pipeline, revenue, and customer outcomes.
Measurement Layer
This layer turns raw data into insight:
- Attribution and contribution tools to understand how content influences multi-touch journeys.
- Cohort and segmentation views to compare performance by audience, channel, or content type.
- Reporting and modeling tools that support trend analysis rather than one-off snapshots.
Activation and Optimization
Measurement is only valuable if it informs action:
- Content optimization tools for updating, consolidating, or retiring assets.
- Distribution and sequencing tools to test how content performs across channels and journeys.
- Workflow systems that help teams operationalize insights and iterate over time.
Measuring What Matters
Content marketing ROI is about influence, contribution, and cumulative impact across the buyer journey. Strong measurement starts with clear objectives, realistic expectations, and metrics tied to decisions rather than vanity.
Attribution will never deliver perfect answers, but it can provide enough direction to guide smarter investment. Teams that measure content ROI well gain clarity, confidence, and the ability to scale what works.

January 2026 Benchmarks: The Gap Between Typical And Top Performing Businesses

January 2026 is our first clean look at how ecommerce businesses are entering the new year. The topline story: the median business is still paying more to grow, while the top quartile is turning the same market into cheaper, more efficient acquisition.
In this article, we’re breaking down what happened in January, how typical performance compares to the 75th percentile, and what operators should do with these benchmarks.
How The Typical Business Started 2026
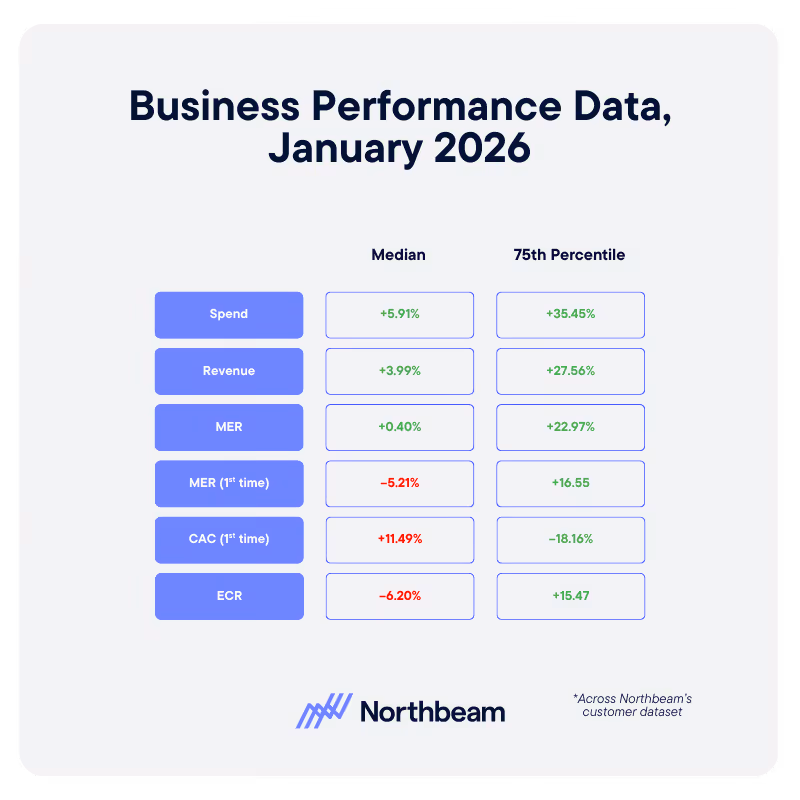
Across Northbeam customers, the median business saw modest growth and worsening new customer economics in January 2026:
There are a few clear implications:
- Businesses increased budgets, but revenue did not keep pace, so blended MER barely moved.
- New customer revenue actually declined, which tells you acquisition was the weak link, not overall demand.
- New customer MER fell and CAC rose, at the same time conversion rate dropped, which is exactly what you see when more spend is chasing lower intent traffic.
If January felt like you were working harder for less convincing performance on first time buyers, these numbers explain why.
What Top Performers Did Differently
The 75th percentile tells a very different story. In the same month, the best performers delivered step change gains in both growth and efficiency:
This is what healthy, scalable growth looks like:
- Revenue nearly kept pace with a very aggressive spend increase.
- Both blended and new customer MER improved, instead of being sacrificed.
- New CAC fell while conversion rate increased, which means these businesses bought better traffic and converted more of it into first time customers at a lower marginal cost.
In other words, January was not just “easier” for the top quartile. They operated with a different set of rules.
Four Levers Behind January’s Top Quartile
1. What 2025 Told Us: Creative Systems Built For Higher Spend
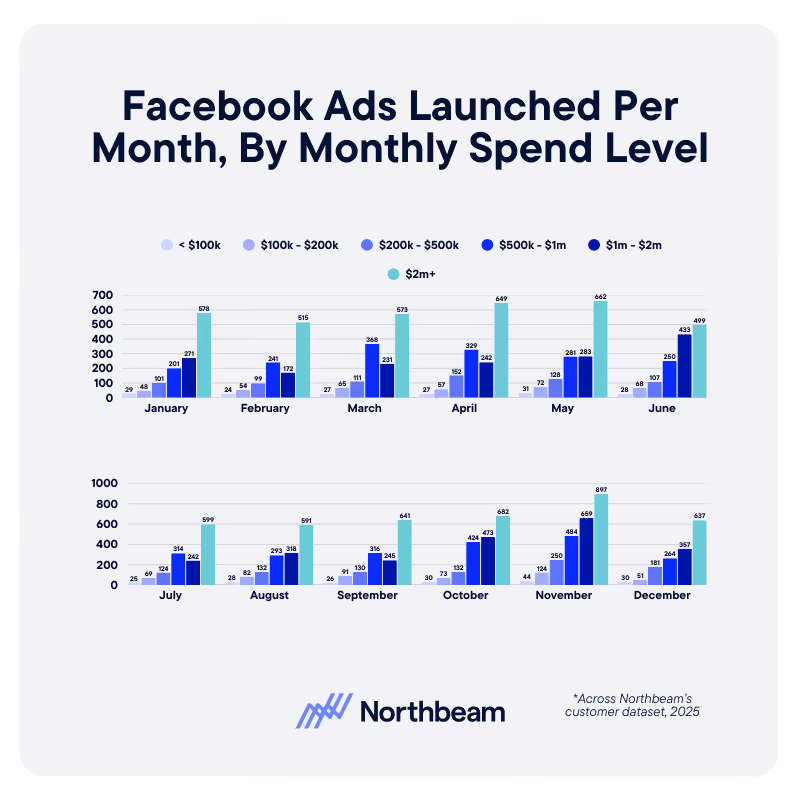
Higher budgets only work if your creative pipeline can support them. Our 2025 data showed a clear relationship between spend bands and ad volume: businesses that spent more launched dramatically more ads, especially on platforms like Meta and TikTok.
In January 2025, the top quartile looked like businesses that had already internalized this:
- They committed to a minimum number of new concepts per week based on their monthly spend, instead of trying to stretch a single winning ad across the month.
- They treated creative capacity as a strategic constraint, budgeting time and resources accordingly.
- They used an attribution source of truth to decide which ideas earned scale, instead of relying on noisy in platform metrics alone.
The result is visible in the benchmarks: higher spend, higher conversion, and lower CAC at the same time.
Higher budgets only work if your creative pipeline can support them.
In January 2026, the top quartile’s results are exactly what you would expect from businesses that took that lesson seriously
Download the full Northbeam 2025 data report.
2. Clear Guardrails On MER And CAC
Median businesses nudged budgets up and accepted whatever economics the market delivered. Top performers acted as if MER and CAC were hard constraints, not nice to have metrics.
Practically, that means:
- Defining MER floors that reflect contribution margin and cash needs, not arbitrary targets.
- Setting CAC ceilings by product or AOV band, so you never let auction pressure quietly erase unit profit.
- Wiring these thresholds into weekly operating views so violations trigger action, not end of month surprises.
You cannot control the market, but you can control how much pain you are willing to tolerate before you pull back.
3. First Time Performance As A Separate Scorecard
In the January aggregate, blended metrics do not tell the full story. Revenue is up a little, MER is flat to slightly positive, and it would be easy to decide you are fine. New customer metrics say otherwise.
Top performers watched first time economics independently:
- First Time MER, First Time CAC, and First Time Revenue sat next to blended metrics in every core report.
- Any period where revenue grew while first time MER fell was treated as a problem, not a win.
- Channels, campaigns, and creative were evaluated on whether they added net new customers at an acceptable price, not just whether they pushed blended MER up for a week.
That discipline shows up directly in the January gap between median and 75th percentile new customer performance.
4. Smarter Use Of January As A Calendar Moment
January is not just “month one” on a clean slate. It is a very specific demand environment: resolution season in some verticals, hangover season in others, and a reset after Q4 promo pressure.
The data suggests that:
- In categories where Q1 demand is structurally strong, winning businesses leaned into January but kept CAC and payback rules tight, instead of assuming last year’s promo economics would hold forever.
- In more fragile verticals, they treated January as a controlled test month for offers and creative, not as a place to force topline at any cost.
- Across the board, they judged January performance against their own category and size cohort, not generic ecommerce averages.
That is why you see top performers able to add new revenue at lower CAC even as the median business struggles.
How To Use These Benchmarks In Your Own Planning

You cannot copy the exact numbers from the 75th percentile, but you can copy the operating patterns that got them there. A practical way to work with the January 2026 data:
- Benchmark Honestly
- Compare your January shifts in spend, revenue, MER, new revenue, new MER, CAC, and conversion rate to both the median and 75th percentile views.
- Decide whether you are closer to “typical” or “top quartile” and why.
- Codify Guardrails
- Turn those comparisons into explicit floors for MER and ceilings for CAC, with separate lines for blended and first time performance.
- Use them to shape bids, budgets, and channel mix from February onward, instead of treating them as a one time post mortem.
- Rebuild Your January And February Scorecards
- Put first time MER, first time CAC, and new revenue on the same level as blended MER in dashboards.
- Flag any week where new customer economics deteriorate while topline looks fine, and react quickly instead of waiting for a quarter end review.
- Align Creative Throughput With Ambition
- If you plan to push budgets meaningfully above January levels, lock in the creative volume that will be required to keep CAC from drifting up.
- Make sure you have the measurement in place to identify which ideas deserve scale and which should be cut early.
The Takeaway For 2026
January 2026 shows two very different realities inside the same market. The median business nudged spend up, saw modest revenue growth, and watched new customer economics slip. The top quartile increased budgets aggressively, grew faster, and improved efficiency at the same time.
The difference is not access to some secret channel. It is whether you are willing to run the year on explicit guardrails, separate scorecards for first time performance, calendar aware planning, and creative systems that can actually support the spend level you want.
If you get those four pieces right, the January 2026 benchmarks stop being a warning and start becoming a baseline for what your own growth can look like over the rest of the year.


Product

RESOURCES
Support
Legal
Follow us
.svg)
