


Marketing teams rely on analytics to make high-stakes decisions about budget allocation, campaign optimization, and attribution. But when marketing data is inaccurate, incomplete, or inconsistent, those decisions quickly become guesswork.
Data reliability is what turns dashboards into decision tools. It ensures that performance metrics reflect reality, attribution models assign credit correctly, and stakeholders can trust the insights guiding strategy.
In this article, we break down how to ensure data reliability in marketing analytics, where it commonly fails, and how teams can build systems and processes that support trusted, actionable insights at scale.
Why Data Reliability Matters in Marketing Analytics
Marketing teams make decisions every day based on what their data appears to be telling them. All of those decisions depend on one foundational assumption: that the data itself can be trusted.
Data reliability refers to the extent to which marketing data is accurate, complete, consistent, timely, and usable as a dependable basis for decision-making.
Reliable data reflects reality. It captures the full picture across channels, updates quickly enough to guide action, and uses consistent definitions so teams are not comparing mismatched numbers.
When those conditions are met, analytics becomes a decision engine rather than a reporting exercise.
But without reliable data, even sophisticated tools and models produce misleading outputs. This lack of trust is widespread. In one industry survey, more than a third of CMOs reported that they do not fully trust their marketing data.
When data reliability fails, the consequences compound quickly:
- Budgets get misdirected toward channels that appear to perform well but do not actually drive incremental value
- Attribution models assign credit incorrectly, skewing future decisions
- Different teams report conflicting numbers, leading to debates about whose data is “right” rather than what action to take
- Over time, stakeholders lose confidence not just in the data, but in marketing’s ability to justify its impact
Reliable data is not a nice-to-have. It is the foundation of credible marketing analytics reliability.
Key Dimensions of Reliable Marketing Data
Reliable marketing data is the result of several foundational qualities working together. When one dimension breaks down, trust in the entire dataset weakens.
Understanding these dimensions helps teams diagnose where reliability issues originate and what needs to be fixed to restore confidence.
Accuracy
Accuracy answers a basic question: does the data reflect correct values? This includes spend, impressions, clicks, conversions, and revenue.
Inaccurate data often stems from tracking misfires, platform discrepancies, or flawed integrations. Even small inaccuracies can cascade into large decision errors when multiplied across campaigns and budgets.
Completeness
Completeness measures whether all relevant data points are captured. Missing channels, dropped conversion events, or partial funnel visibility create blind spots that skew performance analysis.
Data can appear clean while still being incomplete, which makes this one of the most deceptive reliability issues.
Consistency and Format
Consistency ensures that metrics mean the same thing everywhere they appear. A “conversion” should not be defined differently across platforms, dashboards, or time periods.
Inconsistent definitions make comparisons unreliable and erode trust between teams reviewing the same performance from different views.
Timeliness and Freshness
Timely data arrives quickly enough to inform decisions. Stale or delayed data forces teams to react to yesterday’s performance instead of today’s reality. Freshness is especially critical for pacing, optimization, and in-flight campaign adjustments.
Usability and Accessibility
Data must be easy to access, interpret, and act on. If insights require manual extraction, complex explanations, or technical translation, trust breaks down and adoption suffers.
Validity
Validity confirms that transformations, joins, and logic rules correctly represent real-world behavior. Even accurate and complete source data can become unreliable if the underlying data logic is flawed.
Common Sources of Unreliable Marketing Data
Understanding where marketing data typically breaks down makes it easier to prevent errors before they undermine reporting, attribution, and decision-making.
Inconsistent Definitions Across Platforms
One of the most common issues is inconsistent metric definitions.
As mentioned in the last section, a “conversion” might represent a purchase in one system, a form fill in another, and a modeled event elsewhere.
When teams compare or combine these numbers without alignment, the resulting analysis is fundamentally flawed.
Disparate Systems and Siloed Data
Marketing data often lives across multiple platforms, including ad networks, analytics tools, and CRM systems. Without proper integration, these systems produce mismatched views of performance.
Spend, clicks, and revenue fail to line up, leading to confusion and manual reconciliation that erodes trust.
Manual Data Handling
Copying and pasting data between spreadsheets, tools, or decks introduces human error and delays. Manual workflows also make it difficult to audit changes or understand how numbers were calculated, reducing transparency and repeatability.
Outdated or Stale Data
Making decisions based on stale or outdated data is especially damaging for campaign optimization, pacing, and budget reallocation, where timing directly impacts results.
Weak Data Governance
Without clear ownership, standardized processes, and validation checks, reliability becomes reactive rather than systematic.
Poor governance allows small inconsistencies to persist, making it harder to identify the source of errors and restore confidence once trust is lost.
Building a Framework for Reliable Marketing Analytics
Reliable marketing data requires intentional systems, clear ownership, and repeatable processes that make trust the default rather than the exception.
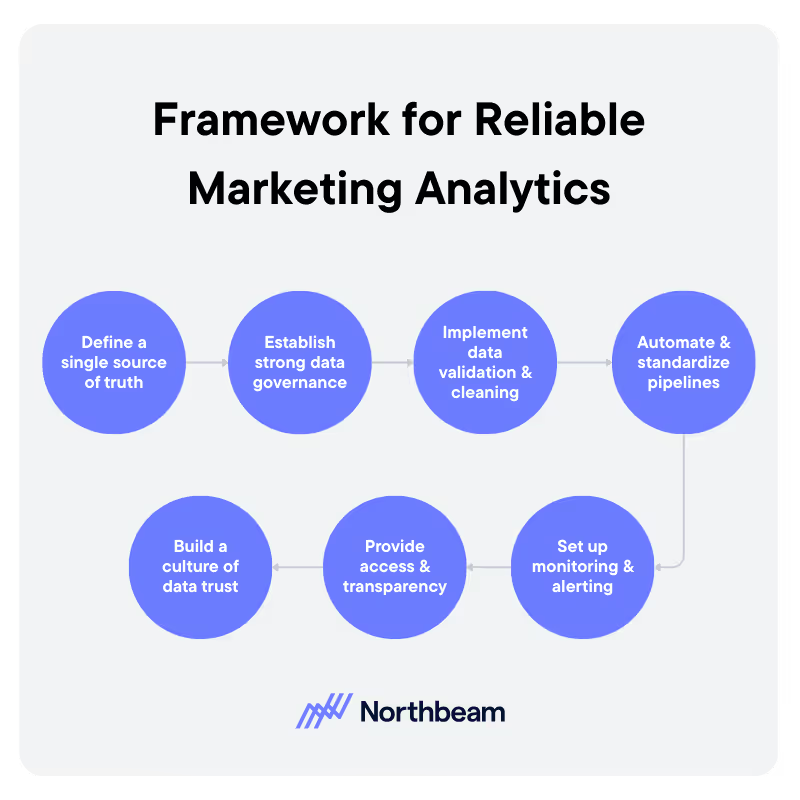
The following steps help teams move from ad hoc fixes to a durable reliability framework:
1. Define a Single Source of Truth
Establish a shared, governed view of core marketing metrics. This does not always mean one tool, but it does mean one agreed-upon pipeline, set of definitions, and reporting layer that everyone uses when making decisions.
2. Establish Strong Data Governance
Clear governance ensures consistency over time. Define metric definitions, naming conventions, ownership, access controls, and audit processes.
When responsibilities are explicit, issues are easier to trace and resolve.
3. Implement Data Validation and Cleaning
Regular validation prevents small issues from becoming systemic failures. Use automated checks to flag missing values, duplicates, unexpected spikes, or format mismatches. Schedule audits to confirm data remains accurate as systems evolve.
4. Automate and Standardize Pipelines
Automation reduces human error and improves repeatability. ETL or ELT pipelines help integrate data across platforms while enforcing consistent transformations, making outputs easier to trust and scale.
5. Set Up Monitoring and Alerting
Monitoring turns reliability into an ongoing process. Alerts for anomalies, failed data feeds, or sudden metric shifts allow teams to respond quickly before flawed data influences decisions.
6. Provide Access and Transparency
Dashboards should not just show numbers. They should help stakeholders understand where data comes from, how it is calculated, and when it was last updated.
7. Build a Culture of Data Trust
Technical fixes alone are not enough. Invest in training, involve marketing teams in data design, and reinforce data-informed decision-making across the organization.
Reporting & Attribution: Ensuring Trust in Your Marketing Metrics
Reporting and attribution outputs directly influence budget decisions, performance narratives, and executive confidence. If the underlying data is unreliable, even the most advanced attribution models will produce misleading results, giving teams a false sense of precision.
Here’s how to build trust in marketing data for attribution and reporting:
Confirm Reliable Inputs
Attribution models, whether last-click, multi-touch, or marketing mix modeling, are only as strong as the data they consume. Flawed channel data, missing conversions, or inconsistent definitions invalidate attribution outputs, regardless of the sophistication of the model itself.
Cleanly Link Spend to Outcomes
Reliable reporting depends on clean, validated connections between ad spend, impressions, clicks, conversions, and revenue.
When these elements are not accurately joined, channels receive too much or too little credit, leading to distorted performance assessments and misallocated budget.
Run Checks Before Attribution
Before running attribution analyses, teams should validate the underlying data. This includes comparing platform-reported metrics, checking funnel logic, and testing for anomalies or sudden shifts that signal data issues rather than real performance changes.
Surface Data Quality in Reports
Trust increases when stakeholders understand data quality. Including reliability indicators such as data completeness, refresh latency, known gaps, or confidence levels helps leaders interpret results appropriately and reduces friction when numbers change.
Validate Insights with Incrementality
Attribution outputs should be tested, not taken at face value. Incrementality metrics, hold-out tests, and controlled experiments help confirm whether attributed channels are truly driving growth, providing a reality check that strengthens confidence in reported results.
Challenges & Trade-Offs

Putting in place marketing data reliability best practices for analytics teams delivers long-term value, but it also introduces real trade-offs that teams need to plan for.
Understanding these challenges upfront helps set realistic expectations and prevents reliability efforts from stalling or losing stakeholder support:
Slower Reporting in the Short Term
Investments in data cleaning, validation, and governance can initially slow down reporting cycles. Teams may need to pause automation or delay insights while issues are corrected, which can feel uncomfortable in fast-moving environments.
Risk of Over-Optimizing for Perfection
Chasing perfectly clean data can lead to analysis paralysis. Not every decision requires flawless inputs. Teams must define what “good enough” looks like for different use cases and avoid blocking action unnecessarily.
Constant Platform and Privacy Changes
Marketing ecosystems evolve quickly. Privacy regulations, identity changes, and platform updates can break existing pipelines, making data reliability an ongoing effort rather than a one-time fix.
Stakeholder Impatience
Leaders and channel owners may push for immediate answers, even when data quality is uncertain. Without alignment, this pressure can undermine reliability initiatives and reintroduce manual shortcuts.
Balancing Speed with Trust
The core tension is between agility and rigor. Effective teams design systems that surface reliable insights quickly, while clearly signaling when data should be treated with caution.
How Clean Data Changes the Story
At first glance, a brand’s paid media performance looked strong. Cost per click was low, reported ROAS was high, and attribution dashboards suggested several channels were outperforming expectations.
Based on those numbers, the team began preparing to scale spend.
But after a deeper review, they discovered multiple data reliability issues. Duplicate conversions were inflating results, and delayed data refreshes were masking recent performance drops.
Once those integration errors were corrected and pipelines were cleaned, reported ROAS fell by 15%. The numbers looked worse, but they were finally accurate.
Rather than reverting to the old view, the team invested in reliability. They implemented clearer data governance, standardized pipelines, and daily validation alerts to catch issues early.
Dashboards were updated to include a simple data health score that surfaced completeness, latency, and error rates. Failed refreshes were annotated, and metric definitions were versioned so changes were transparent.
With trustworthy data in place, decision-making improved.
The team paused channels that had been benefiting from misattribution, reallocated budget toward channels that were genuinely driving incremental value, and scaled spend with confidence.
Growth stabilized, and stakeholder trust in marketing analytics was restored.
Turning Data Reliability Into Action
Building reliable marketing data starts with a focused set of actions that make reliability visible, repeatable, and accountable across teams.
- Run a data reliability audit: Map your core marketing and attribution metrics end to end. Identify where data originates, how it flows through systems, and where it is transformed. Score each metric on accuracy, completeness, freshness, and consistency to surface risk areas.
- Prioritize the biggest failure points: Focus on the top two or three issues causing the most damage, such as delayed refreshes, inconsistent definitions, or manual handoffs. Assign clear owners and timelines so fixes actually get implemented.
- Add a data health dashboard: Make reliability visible. Track indicators like data freshness, error rates, missing fields, and completeness alongside performance metrics. This creates shared awareness and prevents silent failures.
- Include reliability signals in stakeholder reporting: Help leadership interpret results by surfacing confidence indicators directly in reports. When data has known gaps or delays, flag them clearly so decisions are made with appropriate context.
- Establish a regular review cadence: Data reliability is not a one-time project. Revisit definitions, pipelines, and checks monthly or quarterly to adapt to new platforms, campaigns, and measurement needs.
By operationalizing data reliability, teams can move faster with confidence and ensure performance insights truly reflect reality.


.avif)


%25201.avif)


.avif)


.svg)
