Blog

January 2026 Benchmarks: The Gap Between Typical And Top Performing Businesses

The gap between median and top-quartile performance in January shows what disciplined growth actually looks like in 2026.
January 2026 Benchmarks: The Gap Between Typical And Top Performing Businesses

TL;DR

  • Median businesses paid more for less: Spend rose, but new customer revenue fell and CAC increased.
  • Top quartile improved efficiency: Higher budgets, stronger conversion, lower CAC.
  • Acquisition discipline was the gap: Leaders enforced MER floors and CAC ceilings.
  • Creative and guardrails win: Separate first-time metrics and scale creative before budgets.

January 2026 is our first clean look at how ecommerce businesses are entering the new year. The topline story: the median business is still paying more to grow, while the top quartile is turning the same market into cheaper, more efficient acquisition.

In this article, we’re breaking down what happened in January, how typical performance compares to the 75th percentile, and what operators should do with these benchmarks.

How The Typical Business Started 2026

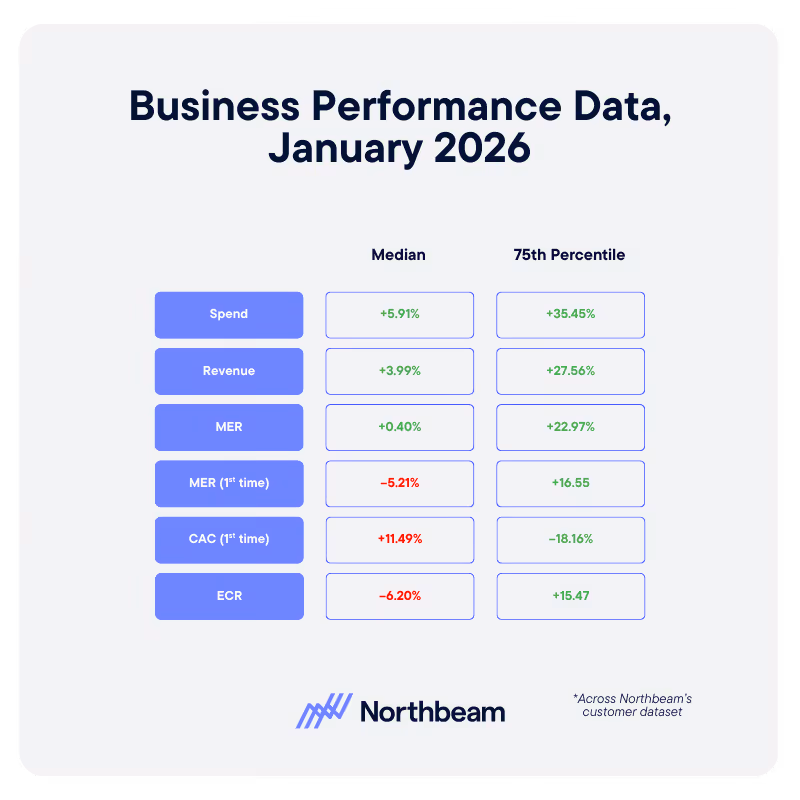
Across Northbeam customers, the median business saw modest growth and worsening new customer economics in January 2026:

There are a few clear implications:

  • Businesses increased budgets, but revenue did not keep pace, so blended MER barely moved.
  • New customer revenue actually declined, which tells you acquisition was the weak link, not overall demand.
  • New customer MER fell and CAC rose, at the same time conversion rate dropped, which is exactly what you see when more spend is chasing lower intent traffic.

If January felt like you were working harder for less convincing performance on first time buyers, these numbers explain why.

What Top Performers Did Differently

The 75th percentile tells a very different story. In the same month, the best performers delivered step change gains in both growth and efficiency:

This is what healthy, scalable growth looks like:

  • Revenue nearly kept pace with a very aggressive spend increase.
  • Both blended and new customer MER improved, instead of being sacrificed.
  • New CAC fell while conversion rate increased, which means these businesses bought better traffic and converted more of it into first time customers at a lower marginal cost.

In other words, January was not just “easier” for the top quartile. They operated with a different set of rules.

Four Levers Behind January’s Top Quartile

1. What 2025 Told Us: Creative Systems Built For Higher Spend

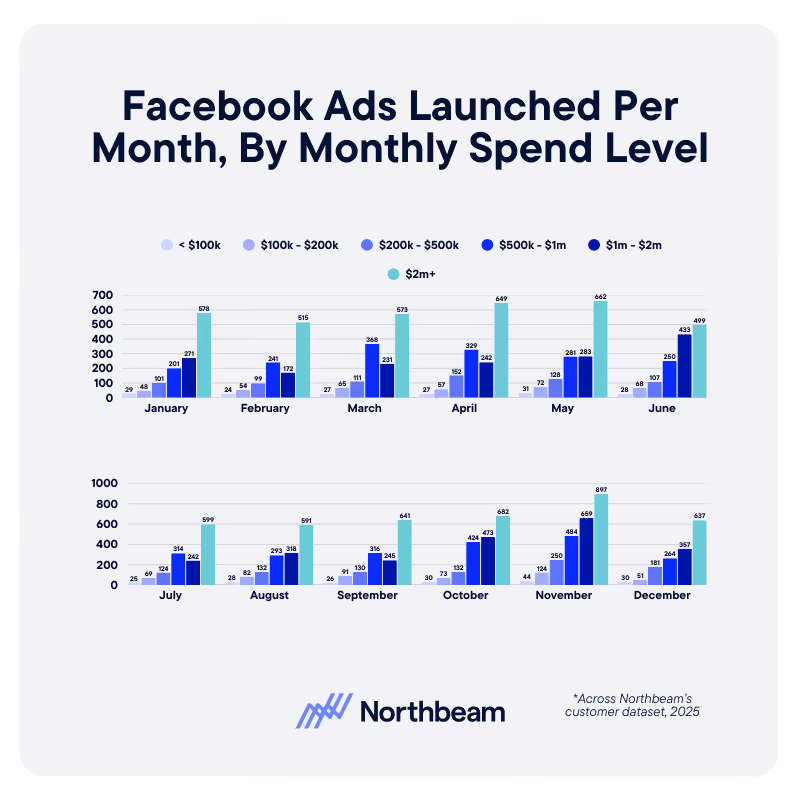
Higher budgets only work if your creative pipeline can support them. Our 2025 data showed a clear relationship between spend bands and ad volume: businesses that spent more launched dramatically more ads, especially on platforms like Meta and TikTok.

In January 2025, the top quartile looked like businesses that had already internalized this:

  • They committed to a minimum number of new concepts per week based on their monthly spend, instead of trying to stretch a single winning ad across the month.
  • They treated creative capacity as a strategic constraint, budgeting time and resources accordingly.
  • They used an attribution source of truth to decide which ideas earned scale, instead of relying on noisy in platform metrics alone.

The result is visible in the benchmarks: higher spend, higher conversion, and lower CAC at the same time.

Higher budgets only work if your creative pipeline can support them.

In January 2026, the top quartile’s results are exactly what you would expect from businesses that took that lesson seriously

Download the full Northbeam 2025 data report.

2. Clear Guardrails On MER And CAC

Median businesses nudged budgets up and accepted whatever economics the market delivered. Top performers acted as if MER and CAC were hard constraints, not nice to have metrics.

Practically, that means:

  • Defining MER floors that reflect contribution margin and cash needs, not arbitrary targets.
  • Setting CAC ceilings by product or AOV band, so you never let auction pressure quietly erase unit profit.
  • Wiring these thresholds into weekly operating views so violations trigger action, not end of month surprises.

You cannot control the market, but you can control how much pain you are willing to tolerate before you pull back.

3. First Time Performance As A Separate Scorecard

In the January aggregate, blended metrics do not tell the full story. Revenue is up a little, MER is flat to slightly positive, and it would be easy to decide you are fine. New customer metrics say otherwise.

Top performers watched first time economics independently:

  • First Time MER, First Time CAC, and First Time Revenue sat next to blended metrics in every core report.
  • Any period where revenue grew while first time MER fell was treated as a problem, not a win.
  • Channels, campaigns, and creative were evaluated on whether they added net new customers at an acceptable price, not just whether they pushed blended MER up for a week.

That discipline shows up directly in the January gap between median and 75th percentile new customer performance.

4. Smarter Use Of January As A Calendar Moment

January is not just “month one” on a clean slate. It is a very specific demand environment: resolution season in some verticals, hangover season in others, and a reset after Q4 promo pressure.

The data suggests that:

  • In categories where Q1 demand is structurally strong, winning businesses leaned into January but kept CAC and payback rules tight, instead of assuming last year’s promo economics would hold forever.
  • In more fragile verticals, they treated January as a controlled test month for offers and creative, not as a place to force topline at any cost.
  • Across the board, they judged January performance against their own category and size cohort, not generic ecommerce averages.

That is why you see top performers able to add new revenue at lower CAC even as the median business struggles.

How To Use These Benchmarks In Your Own Planning

You cannot copy the exact numbers from the 75th percentile, but you can copy the operating patterns that got them there. A practical way to work with the January 2026 data:

  1. Benchmark Honestly
    • Compare your January shifts in spend, revenue, MER, new revenue, new MER, CAC, and conversion rate to both the median and 75th percentile views.
    • Decide whether you are closer to “typical” or “top quartile” and why.
  2. Codify Guardrails
    • Turn those comparisons into explicit floors for MER and ceilings for CAC, with separate lines for blended and first time performance.
    • Use them to shape bids, budgets, and channel mix from February onward, instead of treating them as a one time post mortem.
  3. Rebuild Your January And February Scorecards
    • Put first time MER, first time CAC, and new revenue on the same level as blended MER in dashboards.
    • Flag any week where new customer economics deteriorate while topline looks fine, and react quickly instead of waiting for a quarter end review.
  4. Align Creative Throughput With Ambition
    • If you plan to push budgets meaningfully above January levels, lock in the creative volume that will be required to keep CAC from drifting up.
    • Make sure you have the measurement in place to identify which ideas deserve scale and which should be cut early.

The Takeaway For 2026

January 2026 shows two very different realities inside the same market. The median business nudged spend up, saw modest revenue growth, and watched new customer economics slip. The top quartile increased budgets aggressively, grew faster, and improved efficiency at the same time.

The difference is not access to some secret channel. It is whether you are willing to run the year on explicit guardrails, separate scorecards for first time performance, calendar aware planning, and creative systems that can actually support the spend level you want.

If you get those four pieces right, the January 2026 benchmarks stop being a warning and start becoming a baseline for what your own growth can look like over the rest of the year.

Continue Reading

Lead Attribution to Revenue: Tracking Marketing’s Impact on Sales

Lead Attribution to Revenue: Tracking Marketing’s Impact on Sales

How to Connect Marketing Activity to Pipeline and Revenue
Industry Power Rankings: Which Ecommerce Verticals Actually Won 2025?

Industry Power Rankings: Which Ecommerce Verticals Actually Won 2025?

2025 Was A Year Of Trade-Offs, Not Universal Wins
When Marketing Intelligence Fails (And How to Fix It Before It Costs You)

When Marketing Intelligence Fails (And How to Fix It Before It Costs You)

What to Avoid When Scaling Marketing Data
Setting SEO Objectives How To Align Search Metrics With Business Goals

Setting SEO Objectives: How to Align Search Metrics with Business Goals

Define, Measure, And Operationalize SEO Objectives
The Struggle Under $5M: Why Early-Stage Businesses Saw Revenue Declines In 2025

The Struggle Under $5M: Why Early-Stage Businesses Saw Revenue Declines In 2025

Growth headlines hid a painful reality; what are the lessons for 2026?
Marketing Intelligence: Using Data to Outsmart Your Competition

Marketing Intelligence: Using Data to Outsmart Your Competition

Turn Performance Data and Market Signals Into a Competitive Advantage
What Does AOV Stand For? Increasing Your Average Order Value In Ecommerce

What Does AOV Stand For? Increasing Your Average Order Value In Ecommerce

How to Calculate, Analyze, and Increase AOV Without Hurting Conversion or Retention
5 Takeaways From Moderating C+DV Webinar

5 Takeaways From Moderating Our Clicks + Deterministic Views Webinar With Leading Platforms

What platform leaders agree on about attribution, deterministic views, and why clicks alone can’t explain modern buying behavior.
Ensuring Data Reliability How To Trust Your Marketing Analytics

Ensuring Data Reliability: How to Trust Your Marketing Analytics

Trustworthy Data for Reporting, Attribution, & Decision-Making
SaaS Email Marketing Strategies To Onboard Engage And Retain Your Users

SaaS Email Marketing: Strategies to Onboard, Engage, & Retain Your Users

Design Effective Lifecycle Email Campaigns
Ad Operations 101: How Digital Ads Get Delivered

Ad Operations 101: How Digital Ads Get Delivered

Ad Ops Systems, Workflows, and Delivery Mechanics
How to Build a Customer Acquisition Funnel (Step-by-Step Guide)

How to Build a Customer Acquisition Funnel (Step-by-Step Guide)

Designing, Measure, and Optimize Customer Acquisition
Mid-Funnel Strategies: Nurturing Prospects from Consideration to Intent

Mid-Funnel Strategies: Nurturing Prospects from Consideration to Intent

Don’t Lose Momentum Mid-Funnel
Measuring Brand Performance How To Track Awareness Loyalty And Perception

Measuring Brand Performance: How to Track Awareness, Loyalty, & Perception

Connect Brand Health to Real Business Impact
Points of Parity vs. Points of Difference: Finding Your Brand’s Competitive Sweet Spot

Points of Parity vs. Points of Difference: Finding Your Brand’s Competitive Sweet Spot

Meet Category Expectations While Standing Out in Meaningful Ways
performance-marketing-channels-guide-to-ppc-affiliates Performance marketing Channels A Guide To PPC Affiliates And More

Performance Marketing Channels: A Guide to PPC, Affiliates, & More

Your end-to-end playbook for selecting the right performance channels
What Is the Meta Conversions API? Implementing Server-Side Tracking in a Privacy-First World

What Is the Meta Conversions API? Implementing Server-Side Tracking in a Privacy-First World

Pair Pixel with CAPI for Accurate Measurements
Gamification Marketing: Using Game Mechanics To Boost Ad Engagement & Attribution

Gamification Marketing: Using Game Mechanics to Boost Ad Engagement & Attribution

How can gamification help your marketing ads and attribution?
LinkedIn Segment Reporting How To Analyze Your Ad Audiences

LinkedIn Segment Reporting: How to Analyze Your Ad Audiences on LinkedIn

Use LinkedIn for Smarter Targeting, Creative, and Budget Decisions
Cyber Week 2025 A Data Driven Look At Performance And Strategy

Cyber Week 2025: A Data‑Driven Look at Performance and Strategy

A data-driven look at how DTC brands actually performed during Cyber Week 2025, and why you should adjust your channel mix, pacing, and benchmarks before next year.
Second Party Data Tapping Into Trusted Partner Data For Marketing

Second-Party Data: Tapping Into Trusted Partner Data for Marketing

A Practical Guide to Partner-Sourced Data
Is Your Company Data Mature Understanding Data Maturity Models For Marketing

Is Your Company Data-Mature? Understanding Data Maturity Models for Marketing

Is Your Team Really “Data Driven?”
Introducing Incrementality By Northbeam: Automated Lift Testing You Can Trust

Introducing Incrementality by Northbeam: Automated Lift Testing You Can Trust

Run incrementality tests end-to-end inside Northbeam—automated design, rigorous validation, and unified results alongside your MTA and MMM for confident, daily decision-making.
Reporting on Marketing Automation Performance: Proving the ROI of Your Drip Campaigns

Reporting on Marketing Automation Performance: Proving the ROI of Your Drip Campaigns

Measure, Attribute, and Prove Business Value
Marketing Funnel Automation Scaling Engagement On Autopilot

Marketing Funnel Automation: Scaling Engagement on Autopilot

Build, Automate, and Measure
Why New Customer ROAS Matters More Than Blended Metrics

Why New Customer ROAS Matters More Than Blended Metrics

Why optimizing to New Customer ROAS (nROAS) — not blended ROAS — is the only way to scale net‑new growth, with a simple daily workflow to make it operational.
Channel Strategy How To Choose The Right Marketing Channels For Your Business

Channel Strategy: How to Choose the Right Marketing Channels for Your Business

Evaluate, Test, and Optimize Your Marketing Channels
Ad Fatigue In Digital Marketing How To Recognize And Remedy It

Ad Fatigue in Digital Marketing: How to Recognize & Remedy It

How to Know When Your Audience Has Seen Enough
Churn Analysis Identifying Why Customers Leave And How To Win Them Back

Churn Analysis: Identifying Why Customers Leave (And How to Win Them Back)

Uncover Churn Drivers and Build Stronger Retention Strategies
Funnel Creation Made Simple How To Map Out Your Marketing Funnel

Funnel Creation Made Simple: How to Map Out Your Marketing Funnel

Map, Measure, and Optimize the Customer Journey
Kill Last Click Bias A Simple Playbook For Read During BFCM

Kill Last‑Click Bias: A Simple Playbook for Reads During BFCM

A practical, windowed-read playbook—short for capture, longer for prospecting—to avoid last‑click bias during Cyber Five.
The Cyber Five Pattern What To Expect Heading Into BFCM

The Cyber Five Pattern: What to expect Heading Into BFCM

Planning Cyber Five with pattern‑based pacing and clear measurement reads.
What Is MAU Tracking Monthly Active Users To Gauge Growth

What Is MAU? Tracking Monthly Active Users to Gauge Growth

Learn what Monthly Active Users (MAU) means, how to measure it accurately, and how to use MAU trends to improve product engagement, retention, and growth.
User Segmentation Strategies How To Personalize Marketing For Every Audience

User Segmentation Strategies: How to Personalize Marketing for Every Audience

Learn how to build and activate user segments that power personalized marketing, boost engagement, and drive long-term customer loyalty.
Which Campaigns Benefit Most From CDV

Which Campaigns Benefit Most from C+DV? Prospecting, Reach/Traffic, and Retention by the Numbers

Learning How C+DV Evens the Playing Field
Fogg Behavior Model: Motivation, Ability, and Prompts

Fogg Behavior Model: Motivation, Ability, and Prompts

Apply Behavior Design Principles to Your Marketing Strategy
Lifecycle Marketing 101 For Every Stage Of The Customer Journey

Lifecycle Marketing 101: Engaging Customers at Every Stage of the Journey

Build Customer Relationships That Last

Benchmarks & Stoplights: Turning Data Into Daily Decisions for Ad Optimization

Turn your best performance days into a live decision system with clear green, yellow, and red signals—so your team knows exactly when to scale, pause, or pivot.
Behavioral Data In Marketing How User Behavior Drives Growth

Behavioral Data In Marketing: How User Behavior Drives Growth

Optimize journeys and personalize experiences
Cohort Analysis For Marketers Uncovering Trends In Customer Behavior

Cohort Analysis for Marketers: Uncovering Trends In Customer Behavior

Learn how to use cohort analysis to track retention, forecast LTV, and drive sustainable growth.
User Stickiness How To Measure Customer Engagement Metric

User Stickiness: The Metric to Measure Customer Engagement (and How to Improve It)

Discover how to calculate and improve user stickiness (DAU/MAU) — the key metric for measuring customer engagement and loyalty.

The PESO Model: Integrating Paid, Earned, Shared, and Owned Media

Learn how the PESO model unifies Paid, Earned, Shared, and Owned media into one powerful strategy.
reasons your awarness campaigns arent driving revenue

7 Reasons Your Awareness Campaigns Aren’t Driving Revenue

How evolving attribution models, creative strategy, and platform dynamics are redefining top-of-funnel success this BFCM season.

How Omnilux Drove a 659% ROAS Lift on Pinterest with Northbeam’s Clicks + Deterministic Views

A case study with Northbeam's newest attribution model.
Clicks + Deterministic Views, by Northbeam.

Introducing Clicks + Deterministic Views by Northbeam

A revolutionary new viewthrough model, now available in Northbeam.

Contextual Targeting In Advertising: Reaching Audiences Without Cookies

Discover how contextual targeting delivers privacy-first, high-performing ads without cookies.

First vs Second vs Third-Party Data: What Are They and Why They Matter

Learn the differences between first-, second-, and third-party data.

Zero-Party Data: The New Gold Standard in Privacy-First Marketing

Learn best practices for collection, activation, and governance to drive trust and ROI.
The Explore Exploit Cycle Of Meta's Algorithm

The Explore–Exploit Cycle of Meta’s Algorithm

Why Meta’s algorithm makes performance swing — and how to ride the cycle instead of panicking through the dips.
what-is-gclid-complete-guide-to-google-click-identifier

What Is GCLID? Complete Guide to Google Click Identifier

Learn what GCLID is, how it works, and why it’s essential for accurate Google Ads tracking.
beyond roas fundamentals of advertising hero

Beyond ROAS: Fundamentals of Advertising In 2025

Why relying on ROAS alone can stunt growth—and the metrics that reveal if your ads are truly building a brand.

iOS 26 Won’t Kill Your UTMs – Here’s Proof

Despite headlines warning of doom, our testing shows iOS 26 leaves Northbeam’s UTMs untouched.
what-is-fcblid-guide-to-facebook-click-identifiers-and-tracking-ad-performance

What is fbclid? A Complete Guide to Facebook Click Identifiers and Tracking Ad Performance

This small URL parameter powers big improvements in Meta ad attribution

What Is Data-Driven Marketing? A Complete Guide to Transforming Your Marketing Strategy with Data

Leverage data to improve your marketing strategies

Why You Should Care About MTA, MMM, and Incrementality

Transform Your Marketing Performance
A futuristic cityscape with a glowing digital figure and a person studying analytics, symbolizing insights into Return on Ad Spend and mastering return on ad spend, with the Northbeam logo and text overlay.

What Is ROAS? A Beginner’s Guide to Return on Ad Spend

Learn why ROAS matters and how to maximize your returns
What makes Northbeam data different

What Makes Northbeam Data Different?

Not All Data is Created Equally

What to Expect When Switching to Northbeam

Everything You Need to Know When You Try Out Northbeam
Illustration of pixel tracking concept with magnifying glass over mechanical gears, symbolizing data analysis, and Northbeam logo in the top corner. Text reads: 'What is Pixel Tracking?

What is Pixel Tracking?

Unlock the Power of Pixel Tracking for Better Marketing Insights
What is Multi-Touch Attribution (MTA)?

Multi-Touch Attribution Models: A Complete Guide to Measuring Every Marketing Touchpoint

Understand, compare, and implement MTA for smarter marketing measurement

What is Media Mix Modeling (MMM)?

Wondering what exactly comprises Media Mix Modeling? Get a comprehensive overview of MMM

What is Marketing ROI and How Can You Improve It?

Understand and enhance your marketing ROI
Image of a man utilizing applovin on his phone and measuring the impact of his adds using Northbeam, the multi touch attribution solution for profitable growth

What is AppLovin and How to Leverage it For Marketing Success

Why DTC brands are flocking to AppLovin, and how to make it work for you

What is Marketing Intelligence Software?

Capture the right data for informed marketing decisions
This highlights key marketing metrics with a creative scene of a strategist building a futuristic ship, symbolizing innovation and long-term success strategies, with the Northbeam logo and text overlay.

Top Marketing Metrics to Track for Long-Term Success

Track these essential metrics to drive sustainable growth

What Is Incrementality In Marketing? A Guide to Measuring True Campaign Impact

The Critical Role of Attribution Models in Unlocking Growth
Northbeam presents a marketer’s guide to customer journey mapping, featuring a relaxed professional at a desk, symbolizing strategic planning and marketing success.

The Marketer’s Guide to Customer Journey Mapping

Turn messy customer paths into data-driven strategies for growth

The Future with YouTube Advertising

Navigating rising digital ad costs with Northbeam

The Marketer’s Guide to AI

How modern marketers can best harness the power of AI
Super Bowl Football Field with the Super Bowl logo and Northbeam logo sitting on the 50 yard line

Super Bowl 2025 Advertising Trends & Performance Analysis

The Big Game, Big Spends, and Even Bigger Marketing Moves

Performance Benchmarks: Black Friday Cyber Monday 2023

A look into this year's performance compared to last year.

Serious Data For Serious Growth: How Northbeam Enables HexClad To Stay Efficient with Scale

Leveraging Northbeam for scalable efficiency

The 2024 Guide to Incrementality

A guide to measuring marketing impact

Northbeam's Definitive Guide to Q5 2025

A Northbeam guide to the "hidden" fifth quarter
Abstract illustration showcasing individuals standing on interconnected platforms with glowing gears, representing probabilistic and deterministic approaches in a cookieless future, with the Northbeam logo and text overlay.

Probabilistic vs. Deterministic Attribution Approaches In a Cookieless Future

Combine probabilistic and deterministic models for future-proof attribution

How Will Cookie Deprecation Affect Northbeam? An Explainer

Northbeam's resilience amid third-party cookie deprecation
Northbeam showcases a futuristic city with holographic figures, drones, and digital interfaces, guiding ecommerce brands on Meta's new sensitivity category restrictions.

Meta’s Sensitivity Category Restrictions: A Guide for Ecommerce Brands

How to get to grips with Meta's privacy restrictions

Beyond Walled Gardens: How Marketers Can Thrive in a Fragmented Digital Landscape

Embrace open web strategies in the evolving digital ad landscape
How to Not Get Fired: A 5-Step Guide for CMOs

How To Not Get Fired: A 5-Step Guide for CMOs

Secure your role amid a shifting marketing landscape

Media Mix Modeling (MMM): Build or Buy?

Evaluating the best approach to implementing MMM

Marketing Efficiency Ratio (MER): Definition, Benchmarks, and How it Differs from ROAS

Use MER and ROAS Together for Smarter Decisions
Northbeam is powered by AI, and so will you.

How does Northbeam use AI?

Northbeam's advanced ML models enhance marketing performance
Cost per clicks

Do Cost Per Clicks Matter?

Evaluating the significance of CPC in performance marketing

Google Chrome Won’t be Deprecating Cookies — Yet

Google's decision to retain third-party cookies, and what it means for you
Utm Tracking 101 How To Use Utm Parameters To Measure Campaigns

UTM Tracking 101: How to Use UTM Parameters to Measure and Improve Campaign Performance

Learn how to use UTM parameters to track campaign performance, improve attribution, and optimize ROI with this step-by-step guide for marketers.
Northbeam presents Black Friday and Cyber Monday 2024 predictions and performance with a futuristic digital sphere, symbolizing data-driven insights and analysis.

BFCM 2024 Predictions: How Did We Do?

Wins, surprises, and lessons for 2025
Northbeam presents a seamless omnichannel marketing strategy with a historical meeting room and futuristic digital elements, symbolizing innovation and best practices.

Creating a Seamless Omnichannel Marketing Strategy: Tips & Best Practices

Mastering Omnichannel Marketing by creating a Seamless, Data-Driven Customer Journey
Northbeam highlights customer retention with an elegant historical setting, symbolizing long-term relationships and why retention should be every marketer’s priority.

Beyond Acquisition: Why Retention Should Be Every Marketer’s Priority

Shifting Focus: Why Retention Is the Key to Sustainable Growth and Profitability
Company Northbeam creates an ad spend optimization with a vintage airplane in a high-tech workshop, symbolizing innovation and maximizing Return on Investment from every marketing dollar.

Ad Spend Optimization: How to Get More ROI from Every Marketing Dollar

Stop Wasting Ad Spend: How Smarter Strategies and Tools Can Maximize ROI
Futuristic laboratory scene with advanced technology screens, DNA graphics, and a scientist analyzing data, representing innovation strategies for return on investment with Northbeam during economic uncertainty, with the Northbeam logo and text overlay.

5 Strategies to Maximize ROI During Economic Uncertainty

Use data-driven techniques to thrive during challenging times
a vibrant digital marketing control room with gears, graphs, and data screens, illustrating insights from a beginner's guide to marketing attribution, with a Northbeam logo and overlay.

A Beginner’s Guide to Marketing Attribution: Understanding the Fundamentals

Learn what marketing attribution is and how to harness its power in an ever-changing digital landscape
Northbeam is the perfect tool for performance marketing agencies.

5 Reasons Why Northbeam is the Perfect Tool for Performance Marketing Agencies

The Last Thing You Should Worry About Is Accurate Data

Accounting Modes 101: What Marketers Need to Know

Understanding cash snapshot and accrual performance modes

2025 Marketing Trends to Watch Out For: Part 2

CTV growth, evolving search, nano-influencers, and data privacy

2025 Marketing Trends to Watch Out For: Part 1

Navigating a Shifting Landscape of Generative AI, Social Media, and Data Privacy

It's time to take your marketing

to the next level.

Chat with our team and discover how Northbeam can transform your business.
book a demo