Blog

Industry Power Rankings: Which Ecommerce Verticals Actually Won 2025?

2025 Was A Year Of Trade-Offs, Not Universal Wins
Industry Power Rankings: Which Ecommerce Verticals Actually Won 2025?

TL;DR

  • Growth returned, but often at the expense of MER and first-time CAC.
  • Vertical differences mattered more than ecommerce averages.
  • The biggest advertisers were most willing to tolerate efficiency declines.
  • Winning in 2026 means setting category-specific guardrails and timing scale intentionally.

From a distance, 2025 looked like a clean win for ecommerce. Across Northbeam’s dataset, businesses increased ad spend and revenue, and the “growth is back” story finally felt true.

Up close, a little more nuance is required for the true read..

By vertical, 2025 was a year of trade‑offs: some categories grew fast but at the expense of MER and CAC, others protected economics and took slower topline, and a handful managed a more balanced path.

Using median results from our 2025 Year In Review whitepaper, here’s how eight major verticals actually performed, and what operators should do with that in 2026.

Download the full Northbeam 2025 data report.

Sporting Goods & Fitness: Aggressive Growth at a Cost

For Sporting Goods & Fitness, 2025 was a big year on revenue, but an expensive one.

At the median, businesses in this category increased spend by about +25% and grew revenue roughly +17%. That’s genuine expansion. But median MER fell by nearly 7%, first‑time MER dropped by more than 11%, and first‑time CAC climbed about +17% year over year.

In other words, every marginal customer cost significantly more and delivered less efficient revenue than in 2024, especially in the back half of the year where December was notably harsh for new‑customer economics.

2026 operator takeaway:

Treat Sporting Goods & Fitness as a category where early‑year is your acquisition window and the rest of the year should be managed accordingly. The data shows February through May as the most forgiving period for new‑customer growth. Use those months to build strong cohorts, then spend more of the back half defending MER and increasing LTV (bundles, upsells, replenishment) instead of forcing volume when CAC is structurally higher.

Food & Beverage: Growth that Leaned on LTV

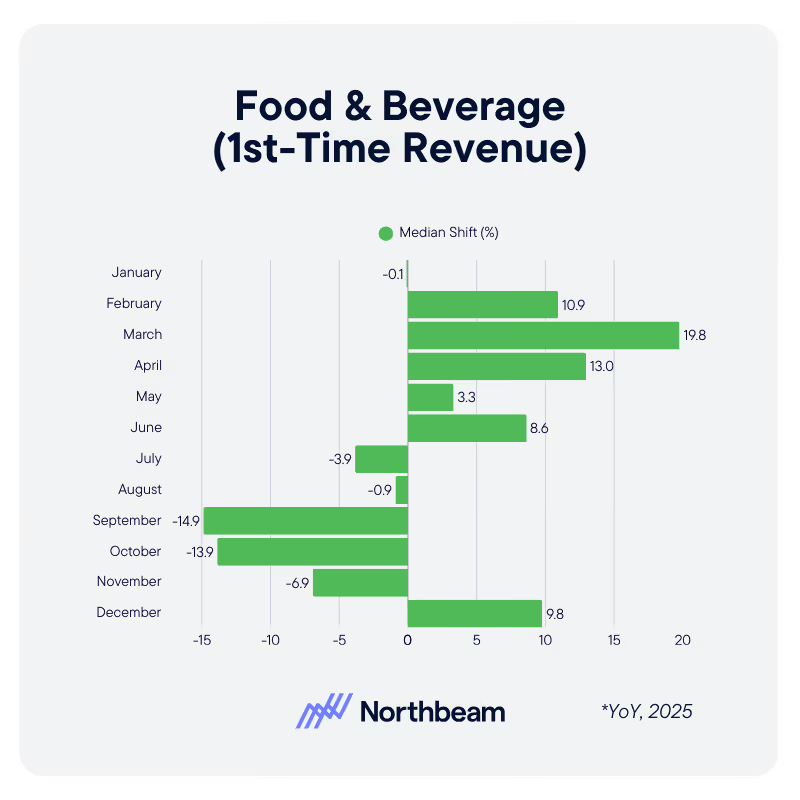
Food & Beverage looks like a quiet success story on the surface. Median revenue grew a bit over +9% while median ad spend actually declined around –5%. That is a strong headline.

Underneath, the category was still under pressure. Median MER slipped by nearly 4%, first‑time MER by about 11%, and first‑time CAC increased more than 5%. In practical terms, businesses got better at squeezing revenue out of existing budgets and existing customers, but new customers were harder and more expensive to win.

2026 operator takeaway:

Plan as if higher acquisition costs are here to stay. That means:

  • Setting clear CAC thresholds for prospecting.
  • Designing acquisition and lifecycle together: subscription mechanics, post‑purchase flows, and thoughtful bundling that help you recoup weaker first‑time MER over time.

The businesses that treat LTV as part of their acquisition constraint, rather than an afterthought, will be the ones that can keep growing in this environment.

Home & Furniture: Timing as the Main Edge

Home & Furniture sits in a familiar position: high AOV, long consideration, and structurally higher CAC than many other categories. In 2025, median businesses grew spend by roughly +8.5% and revenue by about +9.0%, which means budgets and top‑line stayed fairly aligned.

The pressure showed up in how much it cost to create that revenue:

  • Median MER declined about –2.6%.
  • Median first‑time MER dropped around –7.5%.
  • Median first‑time CAC increased close to +9.5%.
  • Median first‑time revenue still grew about +6.7%.

So the sector did add new customers and revenue, but at a higher acquisition cost and tighter efficiency than the year before.

The nuance that matters is timing. The 2025 data highlights May and August as months where Home & Furniture businesses managed to grow revenue and hold comparatively better MER. Q4 produced strong revenue, but new‑customer economics in those weeks were noticeably weaker than in those spring and late‑summer windows.

2026 operator takeaway:

Think of the year as a sequence of deliberate acquisition campaigns rather than a constant push. Lean into proven intent peaks; move‑in seasons, refresh cycles, and the May/August windows the data calls out, and raise the bar for prospecting outside them. In this vertical, you win by being right on timing and payback, not by being “always on.”

Fashion & Accessories: Growth Inside a Narrow Band

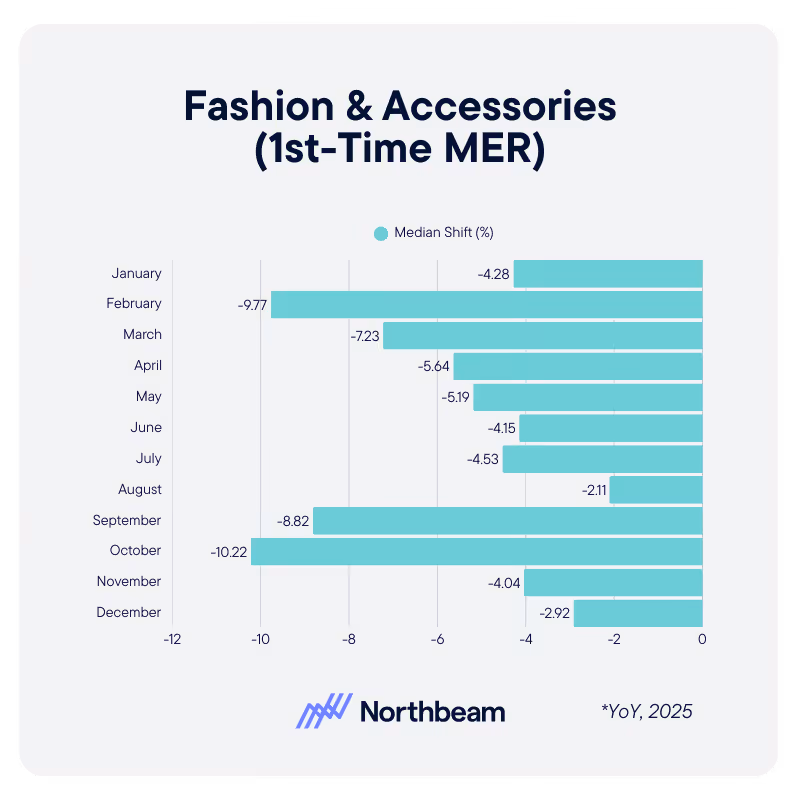
Fashion & Accessories did grow, but with very little margin for error. Median spend was up about +7%, median revenue roughly +6%. Meanwhile, median MER fell just under –2%, first‑time MER fell more than –5%, and first‑time CAC rose nearly +9%.

The monthly curves show a familiar pattern: a few “healthy” months, mainly late spring and early summer, where revenue and MER improved together, and long stretches where raising budgets simply meant paying more for the same or slightly worse revenue outcomes. Fashion could absolutely grow in 2025; it just could not grow indiscriminately.

2026 operator takeaway:

Treat Fashion as a tight‑corridor category. Use the whitepaper’s shape as a sanity check when you build your plan:

  • Design scale around the months where your vertical historically supports both growth and MER.
  • Cap CAC tightly in weaker periods.
  • Use merchandising and bundling (for example, full‑look outfits or multi‑buy offers) to create AOV headroom that helps absorb higher CAC.

Beauty & Personal Care: Uneven Year, Mid‑Year Payoffs

Beauty & Personal Care had one of the more uneven journeys through 2025. At the median, spend and revenue both increased around +3–4%, but MER fell roughly –4%, first‑time MER about –8%, and first‑time CAC rose just over +4%.

Q1 stands out as particularly difficult: weaker revenue, compressed MER, and poor new‑customer economics created a sense that “growth feels bad.” Results improved later; mid‑year and in select Q4 periods, where businesses came in with well‑tested promos and creative instead of scrambling in‑season.

2026 operator takeaway: 

Split the year in two:

  • First half: a structured test phase for offers, bundles, and creative platforms that actually defend MER.
  • Second half: execution—scale only what your own data shows is working.

In beauty, going into holiday with untested concepts is how you end up paying 2025‑style CAC for 2024‑style guesses.

Health & Wellness: Resolution Demand vs. Sustainability

Health & Wellness leaned hard into Q1 resolutions. At the median, spend increased about +9.4%, but revenue only around +4.3%. MER slipped roughly –1.5%, first‑time MER about –7%, and first‑time CAC climbed nearly +7.8%.

So yes, businesses won a lot of January and early‑year customers, but at worse efficiency than 2024. In the back half of the year, the category relied more on existing customers to carry growth as new‑customer economics stayed under pressure.

2026 operator takeaway:

For Health & Wellness, the critical question isn’t just how many people you bring in during January; it’s what those cohorts are worth over time. Use the 2025 shifts in first‑time CAC and first‑time MER as hard context when you:

  • Define acceptable payback windows for your resolution campaigns.
  • Design lifecycle programs, product pathways, and pricing that make those Q1 cohorts financially rational.

Only then decide how far you’re willing to push bids and budgets in the resolution spike.

Baby & Kids: When Always‑On Stops Working

Baby & Kids is where “spend more” was most clearly punished.

On averages, spend rose about +10%, but revenue only +2%, with average MER down roughly –7% and average CAC up +15%. Even at the median—where revenue grew a healthier +7.2% and MER improved about +2.4%—median CAC still increased around +4.2%.

Combine that with heavy seasonality and you get the real story: many businesses pushed budget into the wrong weeks at the wrong cost and paid for it in MER and CAC.

2026 operator takeaway:

Here, timing and cohort quality matter more than raw budget. Use the industry curves to identify:

  • Which months and promo windows historically deliver both higher revenue and acceptable MER.
  • Which high‑CAC pushes did not produce resilient cohorts or meaningful LTV.

Then build a 2026 plan that concentrates acquisition in those proven windows and runs lean everywhere else.

Technology: Big‑Business Aggression, Mixed Outcomes

Technology is the clearest example of aggressive scale in the report.

On averages, Tech businesses increased spend by about +38% and revenue by +28%, while average MER fell roughly –7% and average CAC jumped over +33%. At the median, things look milder: spend +1.3%, revenue +2.8%, MER +1.5%, but first‑time MER still down about –3% and first‑time CAC up roughly +13%.

The gap between average and median tells you what’s really happening: larger tech advertisers are driving the visible growth and are the ones most willing to accept painful CAC and MER trade‑offs. Smaller players are stuck in the same auction, with much less room for error.

2026 operator takeaway:

You cannot simply mirror the biggest budgets in your space. Use MMM and incrementality to determine:

  • Where spend is truly creating net‑new demand.
  • Where it’s just shifting conversions between channels or cannibalizing branded/organic.

Let the whitepaper’s Tech benchmarks define your upper limit on how much pain (MER decline and CAC increase) you’re willing to tolerate, not your default state.

How to Use These Takeaways In 2026

These industry breakdowns aren’t about bragging rights. They’re about understanding the shape of your category’s trade‑offs: how 2025 balanced revenue, MER, and CAC by vertical, and what that implies for 2026.

The key moves are:

  • Benchmark locally, not globally. Compare your performance to businesses in your size band and vertical using the median stats, not to “ecommerce overall.”
  • Set guardrails that reflect reality. Use the MER, first‑time MER, and CAC shifts above as the starting point for your 2026 floors and ceilings—not wishful thinking.
  • Plan around your calendar shape. Build explicit scale windows and harvest windows using the months where your vertical actually supported efficient acquisition.

Every figure cited here, revenue, MER, and CAC changes by vertical, comes directly from Northbeam’s 2025 Year in Review. To download the full data set, click here.

Continue Reading

The Struggle Under $5M: Why Early-Stage Businesses Saw Revenue Declines In 2025

The Struggle Under $5M: Why Early-Stage Businesses Saw Revenue Declines In 2025

Growth headlines hid a painful reality; what are the lessons for 2026?
Marketing Intelligence: Using Data to Outsmart Your Competition

Marketing Intelligence: Using Data to Outsmart Your Competition

Turn Performance Data and Market Signals Into a Competitive Advantage
What Does AOV Stand For? Increasing Your Average Order Value In Ecommerce

What Does AOV Stand For? Increasing Your Average Order Value In Ecommerce

How to Calculate, Analyze, and Increase AOV Without Hurting Conversion or Retention
5 Takeaways From Moderating C+DV Webinar

5 Takeaways From Moderating Our Clicks + Deterministic Views Webinar With Leading Platforms

What platform leaders agree on about attribution, deterministic views, and why clicks alone can’t explain modern buying behavior.
Ensuring Data Reliability How To Trust Your Marketing Analytics

Ensuring Data Reliability: How to Trust Your Marketing Analytics

Trustworthy Data for Reporting, Attribution, & Decision-Making
SaaS Email Marketing Strategies To Onboard Engage And Retain Your Users

SaaS Email Marketing: Strategies to Onboard, Engage, & Retain Your Users

Design Effective Lifecycle Email Campaigns
Ad Operations 101: How Digital Ads Get Delivered

Ad Operations 101: How Digital Ads Get Delivered

Ad Ops Systems, Workflows, and Delivery Mechanics
How to Build a Customer Acquisition Funnel (Step-by-Step Guide)

How to Build a Customer Acquisition Funnel (Step-by-Step Guide)

Designing, Measure, and Optimize Customer Acquisition
Mid-Funnel Strategies: Nurturing Prospects from Consideration to Intent

Mid-Funnel Strategies: Nurturing Prospects from Consideration to Intent

Don’t Lose Momentum Mid-Funnel
Measuring Brand Performance How To Track Awareness Loyalty And Perception

Measuring Brand Performance: How to Track Awareness, Loyalty, & Perception

Connect Brand Health to Real Business Impact
Points of Parity vs. Points of Difference: Finding Your Brand’s Competitive Sweet Spot

Points of Parity vs. Points of Difference: Finding Your Brand’s Competitive Sweet Spot

Meet Category Expectations While Standing Out in Meaningful Ways
performance-marketing-channels-guide-to-ppc-affiliates Performance marketing Channels A Guide To PPC Affiliates And More

Performance Marketing Channels: A Guide to PPC, Affiliates, & More

Your end-to-end playbook for selecting the right performance channels
What Is the Meta Conversions API? Implementing Server-Side Tracking in a Privacy-First World

What Is the Meta Conversions API? Implementing Server-Side Tracking in a Privacy-First World

Pair Pixel with CAPI for Accurate Measurements
Gamification Marketing: Using Game Mechanics To Boost Ad Engagement & Attribution

Gamification Marketing: Using Game Mechanics to Boost Ad Engagement & Attribution

How can gamification help your marketing ads and attribution?
LinkedIn Segment Reporting How To Analyze Your Ad Audiences

LinkedIn Segment Reporting: How to Analyze Your Ad Audiences on LinkedIn

Use LinkedIn for Smarter Targeting, Creative, and Budget Decisions
Cyber Week 2025 A Data Driven Look At Performance And Strategy

Cyber Week 2025: A Data‑Driven Look at Performance and Strategy

A data-driven look at how DTC brands actually performed during Cyber Week 2025, and why you should adjust your channel mix, pacing, and benchmarks before next year.
Second Party Data Tapping Into Trusted Partner Data For Marketing

Second-Party Data: Tapping Into Trusted Partner Data for Marketing

A Practical Guide to Partner-Sourced Data
Is Your Company Data Mature Understanding Data Maturity Models For Marketing

Is Your Company Data-Mature? Understanding Data Maturity Models for Marketing

Is Your Team Really “Data Driven?”
Introducing Incrementality By Northbeam: Automated Lift Testing You Can Trust

Introducing Incrementality by Northbeam: Automated Lift Testing You Can Trust

Run incrementality tests end-to-end inside Northbeam—automated design, rigorous validation, and unified results alongside your MTA and MMM for confident, daily decision-making.
Reporting on Marketing Automation Performance: Proving the ROI of Your Drip Campaigns

Reporting on Marketing Automation Performance: Proving the ROI of Your Drip Campaigns

Measure, Attribute, and Prove Business Value
Marketing Funnel Automation Scaling Engagement On Autopilot

Marketing Funnel Automation: Scaling Engagement on Autopilot

Build, Automate, and Measure
Why New Customer ROAS Matters More Than Blended Metrics

Why New Customer ROAS Matters More Than Blended Metrics

Why optimizing to New Customer ROAS (nROAS) — not blended ROAS — is the only way to scale net‑new growth, with a simple daily workflow to make it operational.
Channel Strategy How To Choose The Right Marketing Channels For Your Business

Channel Strategy: How to Choose the Right Marketing Channels for Your Business

Evaluate, Test, and Optimize Your Marketing Channels
Ad Fatigue In Digital Marketing How To Recognize And Remedy It

Ad Fatigue in Digital Marketing: How to Recognize & Remedy It

How to Know When Your Audience Has Seen Enough
Churn Analysis Identifying Why Customers Leave And How To Win Them Back

Churn Analysis: Identifying Why Customers Leave (And How to Win Them Back)

Uncover Churn Drivers and Build Stronger Retention Strategies
Funnel Creation Made Simple How To Map Out Your Marketing Funnel

Funnel Creation Made Simple: How to Map Out Your Marketing Funnel

Map, Measure, and Optimize the Customer Journey
Kill Last Click Bias A Simple Playbook For Read During BFCM

Kill Last‑Click Bias: A Simple Playbook for Reads During BFCM

A practical, windowed-read playbook—short for capture, longer for prospecting—to avoid last‑click bias during Cyber Five.
The Cyber Five Pattern What To Expect Heading Into BFCM

The Cyber Five Pattern: What to expect Heading Into BFCM

Planning Cyber Five with pattern‑based pacing and clear measurement reads.
What Is MAU Tracking Monthly Active Users To Gauge Growth

What Is MAU? Tracking Monthly Active Users to Gauge Growth

Learn what Monthly Active Users (MAU) means, how to measure it accurately, and how to use MAU trends to improve product engagement, retention, and growth.
User Segmentation Strategies How To Personalize Marketing For Every Audience

User Segmentation Strategies: How to Personalize Marketing for Every Audience

Learn how to build and activate user segments that power personalized marketing, boost engagement, and drive long-term customer loyalty.
Which Campaigns Benefit Most From CDV

Which Campaigns Benefit Most from C+DV? Prospecting, Reach/Traffic, and Retention by the Numbers

Learning How C+DV Evens the Playing Field
Fogg Behavior Model: Motivation, Ability, and Prompts

Fogg Behavior Model: Motivation, Ability, and Prompts

Apply Behavior Design Principles to Your Marketing Strategy
Lifecycle Marketing 101 For Every Stage Of The Customer Journey

Lifecycle Marketing 101: Engaging Customers at Every Stage of the Journey

Build Customer Relationships That Last

Benchmarks & Stoplights: Turning Data Into Daily Decisions for Ad Optimization

Turn your best performance days into a live decision system with clear green, yellow, and red signals—so your team knows exactly when to scale, pause, or pivot.
Behavioral Data In Marketing How User Behavior Drives Growth

Behavioral Data In Marketing: How User Behavior Drives Growth

Optimize journeys and personalize experiences
Cohort Analysis For Marketers Uncovering Trends In Customer Behavior

Cohort Analysis for Marketers: Uncovering Trends In Customer Behavior

Learn how to use cohort analysis to track retention, forecast LTV, and drive sustainable growth.
User Stickiness How To Measure Customer Engagement Metric

User Stickiness: The Metric to Measure Customer Engagement (and How to Improve It)

Discover how to calculate and improve user stickiness (DAU/MAU) — the key metric for measuring customer engagement and loyalty.

The PESO Model: Integrating Paid, Earned, Shared, and Owned Media

Learn how the PESO model unifies Paid, Earned, Shared, and Owned media into one powerful strategy.
reasons your awarness campaigns arent driving revenue

7 Reasons Your Awareness Campaigns Aren’t Driving Revenue

How evolving attribution models, creative strategy, and platform dynamics are redefining top-of-funnel success this BFCM season.

How Omnilux Drove a 659% ROAS Lift on Pinterest with Northbeam’s Clicks + Deterministic Views

A case study with Northbeam's newest attribution model.
Clicks + Deterministic Views, by Northbeam.

Introducing Clicks + Deterministic Views by Northbeam

A revolutionary new viewthrough model, now available in Northbeam.

Contextual Targeting In Advertising: Reaching Audiences Without Cookies

Discover how contextual targeting delivers privacy-first, high-performing ads without cookies.

First vs Second vs Third-Party Data: What Are They and Why They Matter

Learn the differences between first-, second-, and third-party data.

Zero-Party Data: The New Gold Standard in Privacy-First Marketing

Learn best practices for collection, activation, and governance to drive trust and ROI.
The Explore Exploit Cycle Of Meta's Algorithm

The Explore–Exploit Cycle of Meta’s Algorithm

Why Meta’s algorithm makes performance swing — and how to ride the cycle instead of panicking through the dips.
what-is-gclid-complete-guide-to-google-click-identifier

What Is GCLID? Complete Guide to Google Click Identifier

Learn what GCLID is, how it works, and why it’s essential for accurate Google Ads tracking.
beyond roas fundamentals of advertising hero

Beyond ROAS: Fundamentals of Advertising In 2025

Why relying on ROAS alone can stunt growth—and the metrics that reveal if your ads are truly building a brand.

iOS 26 Won’t Kill Your UTMs – Here’s Proof

Despite headlines warning of doom, our testing shows iOS 26 leaves Northbeam’s UTMs untouched.
what-is-fcblid-guide-to-facebook-click-identifiers-and-tracking-ad-performance

What is fbclid? A Complete Guide to Facebook Click Identifiers and Tracking Ad Performance

This small URL parameter powers big improvements in Meta ad attribution

What Is Data-Driven Marketing? A Complete Guide to Transforming Your Marketing Strategy with Data

Leverage data to improve your marketing strategies

Why You Should Care About MTA, MMM, and Incrementality

Transform Your Marketing Performance
A futuristic cityscape with a glowing digital figure and a person studying analytics, symbolizing insights into Return on Ad Spend and mastering return on ad spend, with the Northbeam logo and text overlay.

What Is ROAS? A Beginner’s Guide to Return on Ad Spend

Learn why ROAS matters and how to maximize your returns
What makes Northbeam data different

What Makes Northbeam Data Different?

Not All Data is Created Equally

What to Expect When Switching to Northbeam

Everything You Need to Know When You Try Out Northbeam
Illustration of pixel tracking concept with magnifying glass over mechanical gears, symbolizing data analysis, and Northbeam logo in the top corner. Text reads: 'What is Pixel Tracking?

What is Pixel Tracking?

Unlock the Power of Pixel Tracking for Better Marketing Insights
What is Multi-Touch Attribution (MTA)?

Multi-Touch Attribution Models: A Complete Guide to Measuring Every Marketing Touchpoint

Understand, compare, and implement MTA for smarter marketing measurement

What is Media Mix Modeling (MMM)?

Wondering what exactly comprises Media Mix Modeling? Get a comprehensive overview of MMM

What is Marketing ROI and How Can You Improve It?

Understand and enhance your marketing ROI
Image of a man utilizing applovin on his phone and measuring the impact of his adds using Northbeam, the multi touch attribution solution for profitable growth

What is AppLovin and How to Leverage it For Marketing Success

Why DTC brands are flocking to AppLovin, and how to make it work for you

What is Marketing Intelligence Software?

Capture the right data for informed marketing decisions
This highlights key marketing metrics with a creative scene of a strategist building a futuristic ship, symbolizing innovation and long-term success strategies, with the Northbeam logo and text overlay.

Top Marketing Metrics to Track for Long-Term Success

Track these essential metrics to drive sustainable growth

What Is Incrementality In Marketing? A Guide to Measuring True Campaign Impact

The Critical Role of Attribution Models in Unlocking Growth
Northbeam presents a marketer’s guide to customer journey mapping, featuring a relaxed professional at a desk, symbolizing strategic planning and marketing success.

The Marketer’s Guide to Customer Journey Mapping

Turn messy customer paths into data-driven strategies for growth

The Future with YouTube Advertising

Navigating rising digital ad costs with Northbeam

The Marketer’s Guide to AI

How modern marketers can best harness the power of AI
Super Bowl Football Field with the Super Bowl logo and Northbeam logo sitting on the 50 yard line

Super Bowl 2025 Advertising Trends & Performance Analysis

The Big Game, Big Spends, and Even Bigger Marketing Moves

Performance Benchmarks: Black Friday Cyber Monday 2023

A look into this year's performance compared to last year.

Serious Data For Serious Growth: How Northbeam Enables HexClad To Stay Efficient with Scale

Leveraging Northbeam for scalable efficiency

The 2024 Guide to Incrementality

A guide to measuring marketing impact

Northbeam's Definitive Guide to Q5 2025

A Northbeam guide to the "hidden" fifth quarter
Abstract illustration showcasing individuals standing on interconnected platforms with glowing gears, representing probabilistic and deterministic approaches in a cookieless future, with the Northbeam logo and text overlay.

Probabilistic vs. Deterministic Attribution Approaches In a Cookieless Future

Combine probabilistic and deterministic models for future-proof attribution

How Will Cookie Deprecation Affect Northbeam? An Explainer

Northbeam's resilience amid third-party cookie deprecation
Northbeam showcases a futuristic city with holographic figures, drones, and digital interfaces, guiding ecommerce brands on Meta's new sensitivity category restrictions.

Meta’s Sensitivity Category Restrictions: A Guide for Ecommerce Brands

How to get to grips with Meta's privacy restrictions

Beyond Walled Gardens: How Marketers Can Thrive in a Fragmented Digital Landscape

Embrace open web strategies in the evolving digital ad landscape
How to Not Get Fired: A 5-Step Guide for CMOs

How To Not Get Fired: A 5-Step Guide for CMOs

Secure your role amid a shifting marketing landscape

Media Mix Modeling (MMM): Build or Buy?

Evaluating the best approach to implementing MMM

Marketing Efficiency Ratio (MER): Definition, Benchmarks, and How it Differs from ROAS

Use MER and ROAS Together for Smarter Decisions
Northbeam is powered by AI, and so will you.

How does Northbeam use AI?

Northbeam's advanced ML models enhance marketing performance
Cost per clicks

Do Cost Per Clicks Matter?

Evaluating the significance of CPC in performance marketing

Google Chrome Won’t be Deprecating Cookies — Yet

Google's decision to retain third-party cookies, and what it means for you
Utm Tracking 101 How To Use Utm Parameters To Measure Campaigns

UTM Tracking 101: How to Use UTM Parameters to Measure and Improve Campaign Performance

Learn how to use UTM parameters to track campaign performance, improve attribution, and optimize ROI with this step-by-step guide for marketers.
Northbeam presents Black Friday and Cyber Monday 2024 predictions and performance with a futuristic digital sphere, symbolizing data-driven insights and analysis.

BFCM 2024 Predictions: How Did We Do?

Wins, surprises, and lessons for 2025
Northbeam presents a seamless omnichannel marketing strategy with a historical meeting room and futuristic digital elements, symbolizing innovation and best practices.

Creating a Seamless Omnichannel Marketing Strategy: Tips & Best Practices

Mastering Omnichannel Marketing by creating a Seamless, Data-Driven Customer Journey
Northbeam highlights customer retention with an elegant historical setting, symbolizing long-term relationships and why retention should be every marketer’s priority.

Beyond Acquisition: Why Retention Should Be Every Marketer’s Priority

Shifting Focus: Why Retention Is the Key to Sustainable Growth and Profitability
Company Northbeam creates an ad spend optimization with a vintage airplane in a high-tech workshop, symbolizing innovation and maximizing Return on Investment from every marketing dollar.

Ad Spend Optimization: How to Get More ROI from Every Marketing Dollar

Stop Wasting Ad Spend: How Smarter Strategies and Tools Can Maximize ROI
Futuristic laboratory scene with advanced technology screens, DNA graphics, and a scientist analyzing data, representing innovation strategies for return on investment with Northbeam during economic uncertainty, with the Northbeam logo and text overlay.

5 Strategies to Maximize ROI During Economic Uncertainty

Use data-driven techniques to thrive during challenging times
a vibrant digital marketing control room with gears, graphs, and data screens, illustrating insights from a beginner's guide to marketing attribution, with a Northbeam logo and overlay.

A Beginner’s Guide to Marketing Attribution: Understanding the Fundamentals

Learn what marketing attribution is and how to harness its power in an ever-changing digital landscape
Northbeam is the perfect tool for performance marketing agencies.

5 Reasons Why Northbeam is the Perfect Tool for Performance Marketing Agencies

The Last Thing You Should Worry About Is Accurate Data

Accounting Modes 101: What Marketers Need to Know

Understanding cash snapshot and accrual performance modes

2025 Marketing Trends to Watch Out For: Part 2

CTV growth, evolving search, nano-influencers, and data privacy

2025 Marketing Trends to Watch Out For: Part 1

Navigating a Shifting Landscape of Generative AI, Social Media, and Data Privacy

It's time to take your marketing

to the next level.

Chat with our team and discover how Northbeam can transform your business.
book a demo