


The best growth teams don’t just look at averages, they study how groups of customers behave over time.
Averages might tell you that retention is holding steady, but they won’t reveal that your most recent customers are churning faster, or that last quarter’s cohort is spending more slowly than the one before.
Cohort analysis groups customers by a shared characteristic, and then tracks how those groups evolve across consistent time intervals.
By comparing outcomes like retention, engagement, or revenue period over period, you uncover patterns that aggregate metrics often obscure.
In this guide, you’ll learn:
- When to use acquisition vs. behavioral cohorts
- How to interpret cohort tables and retention analysis curves
- Which questions cohorts answer better than traditional segmentation
- How to apply cohort insights to messaging, lifecycle programs, product nudges, and budget allocation
What Is Cohort Analysis & Why It Matters
Cohort analysis is the practice of grouping customers who share a meaningful trait at a specific point in time.
For example, you may group together everyone who made their first purchase in April, and then track how their behavior unfolds in consistent intervals (days, weeks, or months since that first purchase).
Basically, instead of looking at broad averages or segments, you’re watching how groups move over time.
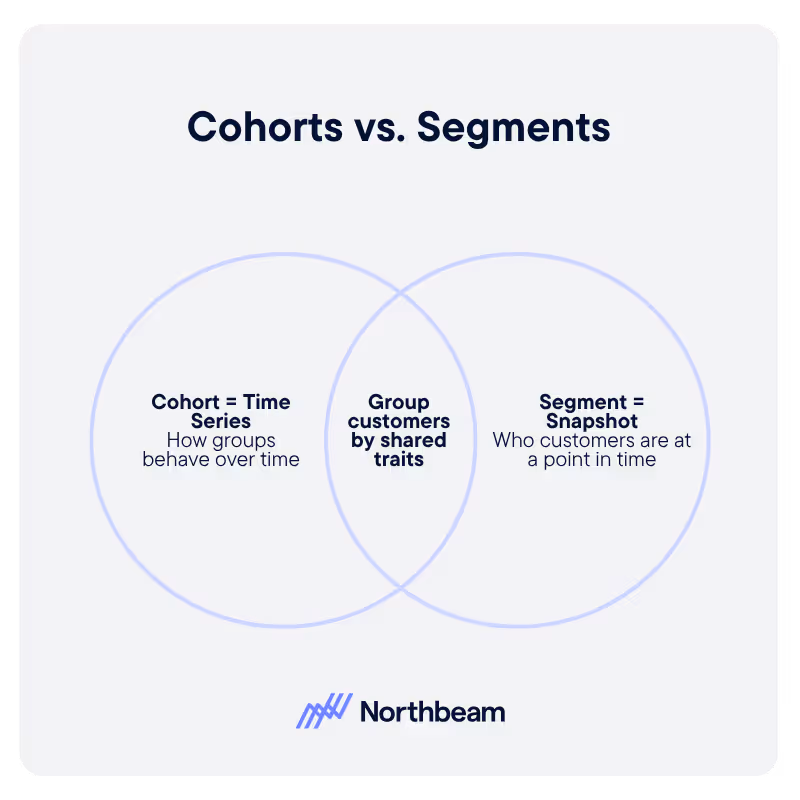
Cohort analysis vs segmentation:
- A segment is a snapshot: “high-value shoppers” or “subscribers who opened last week’s email.”
- A cohort is (usually) a time series: “customers acquired in Q2” or “users who completed onboarding within 7 days.”
With cohorts, you’re not just asking who they are but how their behavior evolves; whether they ramp up quickly, form lasting habits, or drop off early.
From a business perspective, this shift in lens unlocks several advantages:
- Distinguish acquisition from retention. Cohorts clarify whether growth is driven by bringing in more customers or by getting existing ones to stick around longer.
- Spot product-market fit signals. If newer cohorts retain better than older ones, it suggests your product or marketing changes are hitting the mark.
- Guide lifecycle investments. Cohorts reveal exactly where drop-offs occur, whether that’s during onboarding, in months 2-3, or after a promotion ends.
- Enable realistic lifetime value cohort forecasting. Instead of relying on blended averages, you can model spend and churn analysis by cohort to get more accurate projections.
Finally, cohorts make experimentation cleaner.
When you launch a change (say, a new onboarding flow or pricing strategy) you can measure its impact directly by comparing post-change cohorts against earlier baselines, while controlling for time-based effects like seasonality.
The Main Cohort Types
Not all cohorts are created equal. Depending on your goals, you might group customers by when they first arrived, what they did inside your product, or even their predicted likelihood to churn.
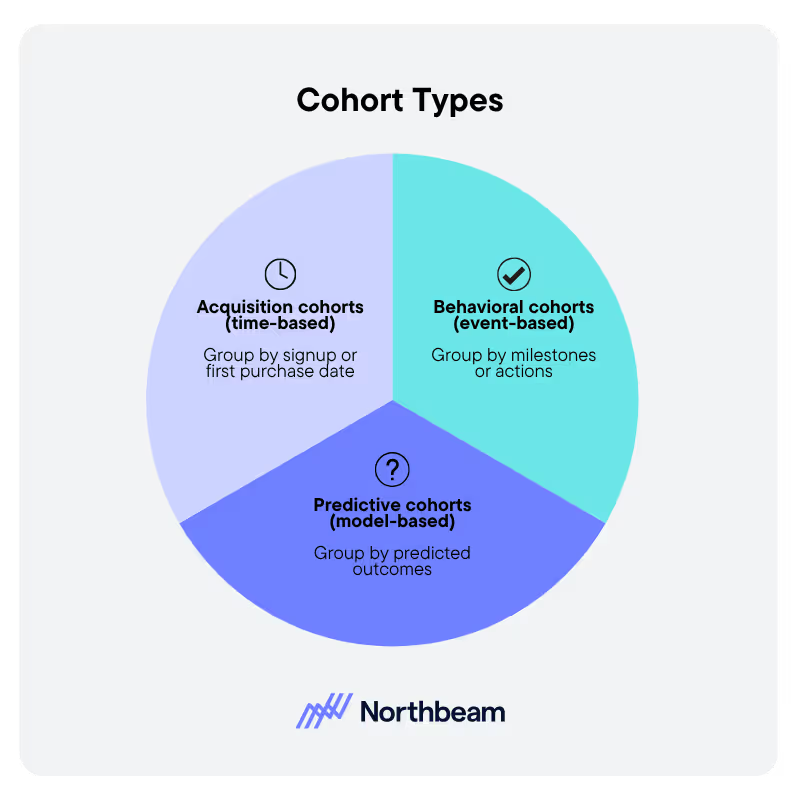
The three most common (and useful) types are:
1. Acquisition Cohorts (Time-Based)
These cohorts group customers by when they first interacted with your brand, whether that’s initial signup, first purchase, or first touchpoint.
They help answer questions like:
- Are our newest customers retaining better than earlier ones?
- Do promotion-driven cohorts lapse faster?
- Which acquisition months generated the strongest downstream lifetime value cohorts?
2. Behavioral Cohorts (Event-Based)
Here, customers are grouped by milestones or actions, such as:
- Completing onboarding within seven days
- Using a feature three times in their first month
- Making two or more purchases within 30 days
- Opting into SMS updates
These cohorts reveal which behaviors correlate with long-term value and which nudges can accelerate customers toward their “aha” moment.
3. Predictive Cohorts (Model-Based)
Predictive cohorts use machine learning or rules-based models to group customers by their likelihood of future outcomes.
For example, using cohorts to forecast LTV, churn risk, or upsell readiness.
They’re particularly powerful for targeting high-impact interventions like retention offers, VIP perks, or win-back campaigns.
Where Cohorts Shine
Across all three types, cohorts provide sharper insights than averages:
- Retention: Visualize survival curves to spot “cliff” periods where customers fall away.
- Monetization: Track cumulative revenue to see payback periods and the lasting impact (or decay) of promotions.
- Channel quality: Compare downstream metrics for customers acquired from different campaigns or offers, without relying on blunt last-click logic.
Non-Linearity and Overlap
But keep in mind that customers aren’t static: they can move between behaviors and risk levels.
That’s why cohort definitions should be consistent but flexible enough to reflect product changes. For instance, an onboarding redesign might shift which behaviors best predict retention.
How to Read a Cohort Table
Cohort tables are the bread and butter of cohort analysis, but they can feel intimidating at first glance.
Once you understand the structure, though, they become one of the most powerful ways to visualize customer behavior.
Structure:
- Rows represent cohorts; for example, everyone who made their first purchase in January, February, March, and so on.
- Columns represent intervals since the anchor event, such as Week 0, Week 1, Week 2 or Month 1, Month 2, Month 3.
- Cells contain the metric you’re tracking; most often retention (active rate), repeat purchase rate, or revenue per user.
This layout allows you to compare how different cohorts behave over time, and spot patterns that would be invisible in an average.
Patterns to look for:
- Diagonal trends: If newer cohorts consistently perform better (or worse) than older ones, you may be seeing the impact of product improvements or acquisition channel shifts.
- Early-life retention: The first 1-2 intervals are often make-or-break. A steep fade here usually points to onboarding friction.
- Promotion fingerprints: Sharp spikes followed by rapid drop-off suggest discount-driven behavior rather than habit formation.
- Plateaus vs. compounding: Flat cumulative revenue per cohort means limited expansion, while stair-stepped growth indicates that cross-sell or upsell strategies are working.
Normalization & denominators:
- Consistency is critical. Always keep denominators the same (e.g., percent of the original cohort).
- When analyzing revenue, use per-user or cumulative metrics to control for cohort size differences.
- This ensures that small and large cohorts can be compared on equal footing.
Strategies & Plays Driven by Cohorts
Cohort analysis isn’t just about spotting patterns. It’s about using those patterns to shape smarter acquisition, activation, and retention strategies.
Here are some of the most effective plays for cohort analysis for ecommerce marketers.
Acquisition Quality Plays
Not all channels or campaigns produce customers of equal value. Cohorts let you compare retention, spend, and payback by acquisition source.
- Identify which campaigns generate customers who stick around for 90+ days and reduce spend on those that churn early, even if the upfront CPA looks efficient.
- Spot seasonal dynamics, such as holiday buyers who purchase once and vanish, and design post-purchase sequences tailored to those groups.
Onboarding Acceleration
The first days or weeks often determine whether a customer becomes long-term. Behavioral cohorts highlight who reaches critical milestones and who doesn’t.
- Define cohorts around “aha” actions (e.g., creating a project, adding a payment method, completing a profile).
- Use guided tours, checklists, or nudges to help lagging customers reach those milestones.
- Track retention analysis curves to see how accelerating onboarding changes long-run value.
Monetization and Expansion
Cohorts also reveal where growth opportunities lie beyond the first transaction.
- Create cohorts for customers who try a new product line, hit an AOV threshold, or upgrade to a subscription.
- Test time-sensitive offers (like encouraging a second purchase within 21–30 days) and compare repeat rates against prior cohorts.
- Monitor cumulative revenue per cohort to measure lift from cross-sell, bundling, or loyalty programs.
Churn Risk and Win-Back
Cohorts segmented by inactivity or churn risk help you prioritize interventions.
- Define risk cohorts such as “no sessions in 14 days” or “no purchases in 60 days.”
- Start with light-touch re-engagement (reminders, testimonials, social proof) before resorting to discounts.
- Measure success by the reactivation rate and the retention curve of reactivated cohorts.
Pricing & Offer Tests
Because cohorts are anchored in time, they’re perfect for evaluating pricing and packaging changes.
- Compare cohorts exposed to different price points or trial lengths.
- Look beyond aggregate revenue to see whether short-term boosts come at the expense of long-term retention or payback.
B2C vs. B2B Nuances
- B2C cohorts often emphasize purchase frequency, promotional impact, and early repeat behavior.
- B2B cohorts focus more on behavior milestones, like inviting teammates or installing integrations, that predict renewal likelihood.
Tools, Data, and Setup
Cohort analysis only works if the data foundation is solid. Before you can run sophisticated plays, you need consistent tracking, clear definitions, and the right workflow in place.
Data Foundation
- Event tracking: Use clean, consistent naming for your anchor event (e.g., first purchase, signup) and any key milestones. Ambiguity here leads to messy cohorts.
- Identity resolution: Stitch sessions, devices, and channels into unified profiles so you can follow a customer’s journey across touchpoints.
- Time buckets: Choose clear intervals (weekly or monthly) that align with your buying cycle. For fast-moving eCommerce, weekly may be best; for subscription businesses, monthly is often more telling.
Definitions to Standardize
Without standardized definitions, cohort metrics quickly become unreliable. Make sure your team aligns on:
- Cohort anchors: What starts the clock: first purchase, signup, or another trigger?
- Inclusion rules: Who counts as “new” versus “returning”?
- Inactivity windows & reactivation criteria: At what point does a customer count as churned, and when do they re-enter?
- Metric definitions: What exactly is an “active” or “retained” user? Are values measured per user or per account?
Workflow & Governance
A repeatable workflow keeps cohorts actionable rather than academic.
- Instrument events
- Validate data quality
- Establish baseline cohorts
- Launch experiments
- Read results on new cohorts
- Iterate
Add guardrails to avoid common pitfalls:
- Use sampling checks so small cohorts don’t produce noisy conclusions.
- Respect customer experience with frequency caps and preference centers when triggering cohort-based messaging.
Tooling Landscape (Vendor-Neutral)
You don’t need a specific platform to get started, but you do need the right categories of tools:
- Web/app analytics: For basic cohort tables and explorations. For example, consider a GA4 cohort exploration for retention.
- Product analytics: For behavioral and predictive cohorts, consider product analytics cohort playbooks with the ability to overlay charts by segment.
- Marketing automation/journey builders: To act on cohorts in real time. For example, nudging “users who didn’t reach a given milestone by Day 7.”
Cohorts in Measurement & Forecasting
Cohort analysis isn’t just for diagnosing problems. It’s a powerful tool for measurement, forecasting, and communicating results at the executive level.
By anchoring customer behavior over time, cohorts give you cleaner comparisons and more reliable projections than averages ever could.
Experimentation
When you launch a new initiative, whether it’s a pricing test, onboarding flow, or marketing offer, cohorts create a natural before-and-after view.
By anchoring on the launch date, you can compare users acquired after the change to earlier cohorts, isolating its impact while controlling for seasonality and other time-based effects.
Attribution Complement
Attribution models help answer how customers converted by mapping the path of touches along the journey.
Cohorts answer what happens after: do those customers stick, grow, and pay back?
Together, attribution and cohorts provide a full picture: one approach for acquisition efficiency, the other for long-term value.
Forecasting and Budgeting
Cohort-level LTV curves and payback charts let you project revenue more realistically.
Instead of relying on blended averages, you can model how specific cohorts spend and churn over time.
This prevents a common pitfall: over-investing in channels that look cheap upfront but produce weak, short-lived customers.
Board-Level Storytelling
Cohort visuals also resonate at the executive and board level.
A single chart showing cumulative revenue by cohort versus CAC can illustrate improving unit economics, or highlight when acquisition quality has slipped.
It’s a clear way to demonstrate progress, justify budget allocation, and keep stakeholders aligned.
Implementation Considerations
Even the best cohort strategy can fall apart without the right cadence, metrics, and governance.
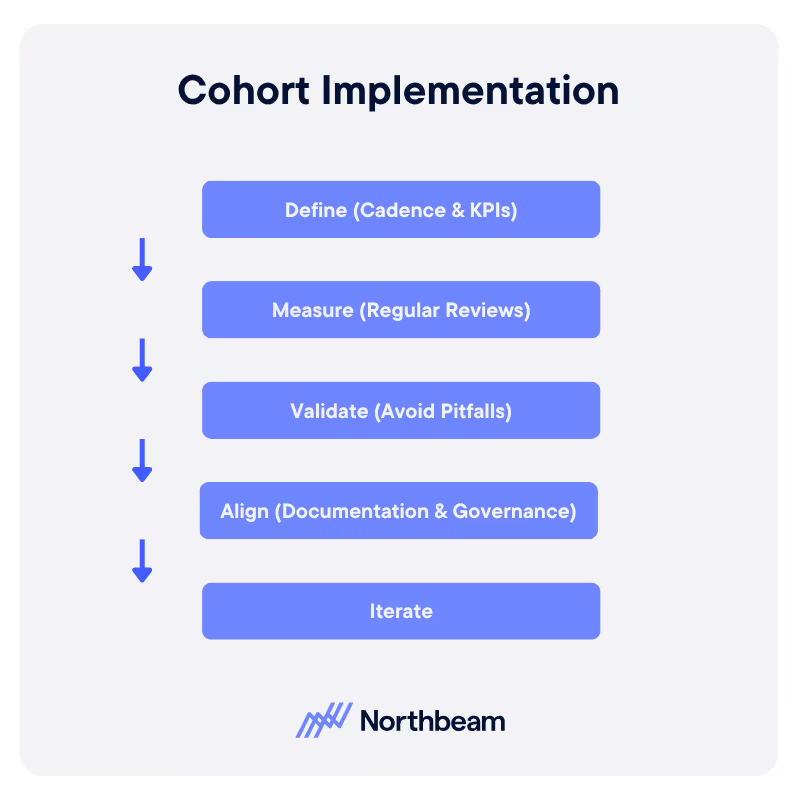
To keep insights consistent and actionable, teams should align on how often to review cohorts, which KPIs to track, and how to avoid common pitfalls.
Cadence
- Weekly: Focus on early-life retention and activation milestones; the critical leading indicators of long-term value.
- Monthly: Review cumulative revenue, payback trends, and emerging differences across acquisition sources.
- Quarterly: Reassess cohort anchors, behavior definitions, and predictive features to ensure they still reflect how customers interact with your product.
KPIs by Objective
- Acquire: 30/60/90-day active rate, first-to-second purchase conversion, time to second purchase.
- Activate: “Aha” milestone completion rate by Day X, median time to value.
- Monetize: Cumulative revenue per user, attach/expansion rate, average orders per user by interval.
- Retain: Survival or retention rates at key intervals (e.g., Month 3, Month 6), churn analysis by risk cohort.
- Win-back: Reactivation rate and post-reactivation retention curves.
Common Pitfalls
- Overfitting: Small cohorts can produce noisy data; smooth trends before making decisions.
- Shifting definitions: Changing what counts as “active” or “retained” mid-stream without backfilling history breaks comparability.
- Promo distortion: Don’t mistake short-lived spikes from discounts or promos as durable gains.
- Denominator drift: Watch for exclusions (like refunds or cancellations) that alter the base and skew results.
Change Management
- Keep everyone on the same page with clear documentation and governance.
- A simple one-pager listing definitions, SQL/event names, and links to dashboards helps teams avoid confusion and ensures that cohort metrics remain consistent across the organization.
The Power of Cohorts
Cohort analysis shifts marketing from static averages to dynamic trajectories.
By anchoring on meaningful events and tracking how outcomes unfold over time, you can see exactly where value is created (or lost) and tie your interventions to measurable improvements in retention, monetization, and payback.
The playbook is simple but powerful: start with crisp definitions, set consistent intervals, and build a baseline dashboard. From there, run targeted experiments, measure how new cohorts respond compared to prior ones, and keep iterating.
The reward is more than just sharper insights: it’s a durable growth system.
Cohorts give you the confidence to double down on channels and behaviors that create lasting value, while avoiding the trap of chasing short-term spikes that fade away just as quickly.


.avif)


%25201.avif)


.avif)


.svg)
