


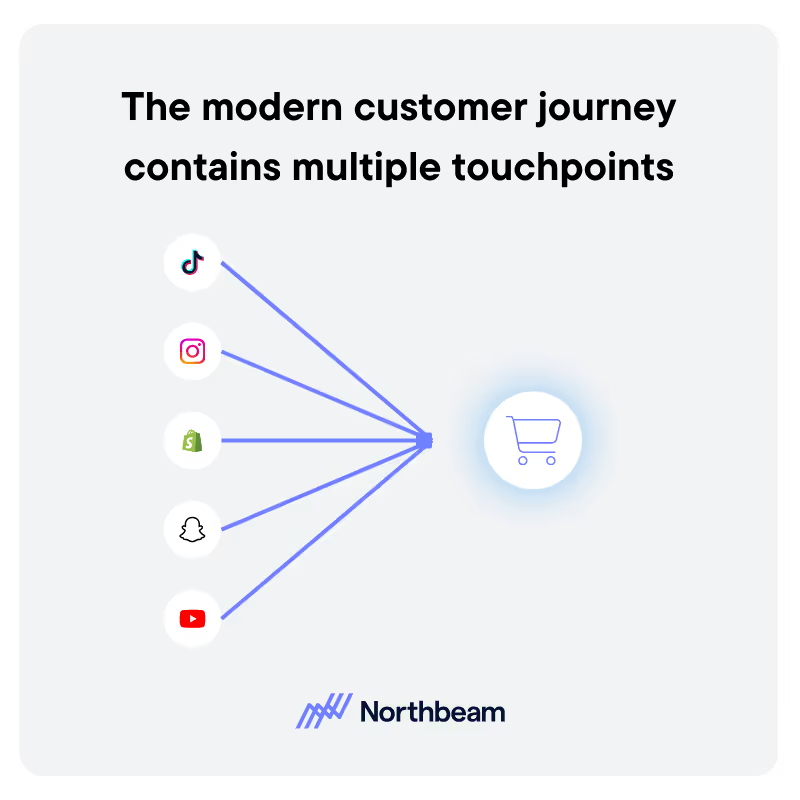
Modern buyer journeys are anything but simple.
A customer might first discover your brand through a social ad, read a blog post days later, click a retargeting email, and finally convert after a branded search.
If you rely on single-touch attribution, giving 100% of the credit to either the first or last click, you miss the bigger picture.
That’s where Multi-Touch Attribution (MTA) comes in.
By distributing credit across every touchpoint, MTA reveals the true value of each channel in driving conversions.
Instead of guessing which interactions matter most, you gain a holistic, data-driven view of the entire funnel.
In this guide, we’ll break down what multi-touch attribution is, why MTA is critical in modern marketing, the different models you can use, and how to implement them effectively.
You’ll also see how advanced attribution platforms like Northbeam help solve the challenges that often limit other solutions.
What Is Multi-Touch Attribution?
Multi-Touch Attribution (MTA) is a marketing measurement method that assigns credit for a conversion across every touchpoint a customer interacts with along their journey. rather than giving 100% of the credit to the first or last click.
Wondering how multi-touch attribution works? At its core, MTA is designed to answer a simple but critical question: Which marketing channels and interactions actually contribute to a sale?
Instead of oversimplifying performance by rewarding only one step, MTA distributes credit proportionally across multiple touchpoints, such as an initial social ad, an email reminder, a retargeting click, and a branded search, to give marketers a more accurate view of what’s driving results.
The core purpose of MTA is to uncover the true influence of each channel in moving prospects down the funnel.
This helps teams optimize spend, refine strategy, and understand how upper-funnel activities (like awareness campaigns) work together with lower-funnel drivers (like paid search or direct visits) to generate conversions.
Why MTA Matters for Marketing
Today’s buyer journeys rarely follow a straight line.
A customer might discover your brand through a TikTok ad, research products via a blog post, sign up for a newsletter, and only weeks later click a retargeting ad before finally purchasing.
If you’re using a single-touch model, all of that complexity gets reduced to one moment: either the very first click or the very last.
The shortcomings of single-touch models include:
- Skewed insights: Last-click attribution tends to overvalue lower-funnel channels like search or retargeting, while first-click attribution may inflate the role of early awareness channels.
- Misallocated budgets: If only one touchpoint receives full credit, marketers risk over-investing in the wrong channels and undervaluing others that actually play a critical supporting role.
- Incomplete customer understanding: Single-touch models can’t show how channels interact across the funnel, making it harder to identify which strategies truly drive momentum toward conversion.
The benefits of multi-touch attribution models are:
- Holistic performance measurement: By distributing credit across multiple touchpoints, MTA captures the real contribution of each channel in the path to purchase.
- Smarter resource allocation: With a clearer sense of which campaigns build awareness, nurture interest, and close deals, marketers can confidently adjust budgets to maximize ROI.
- Stronger customer journeys: MTA highlights the interplay between channels (e.g., how paid social might spark interest that email later converts) so teams can design more effective cross-channel strategies.
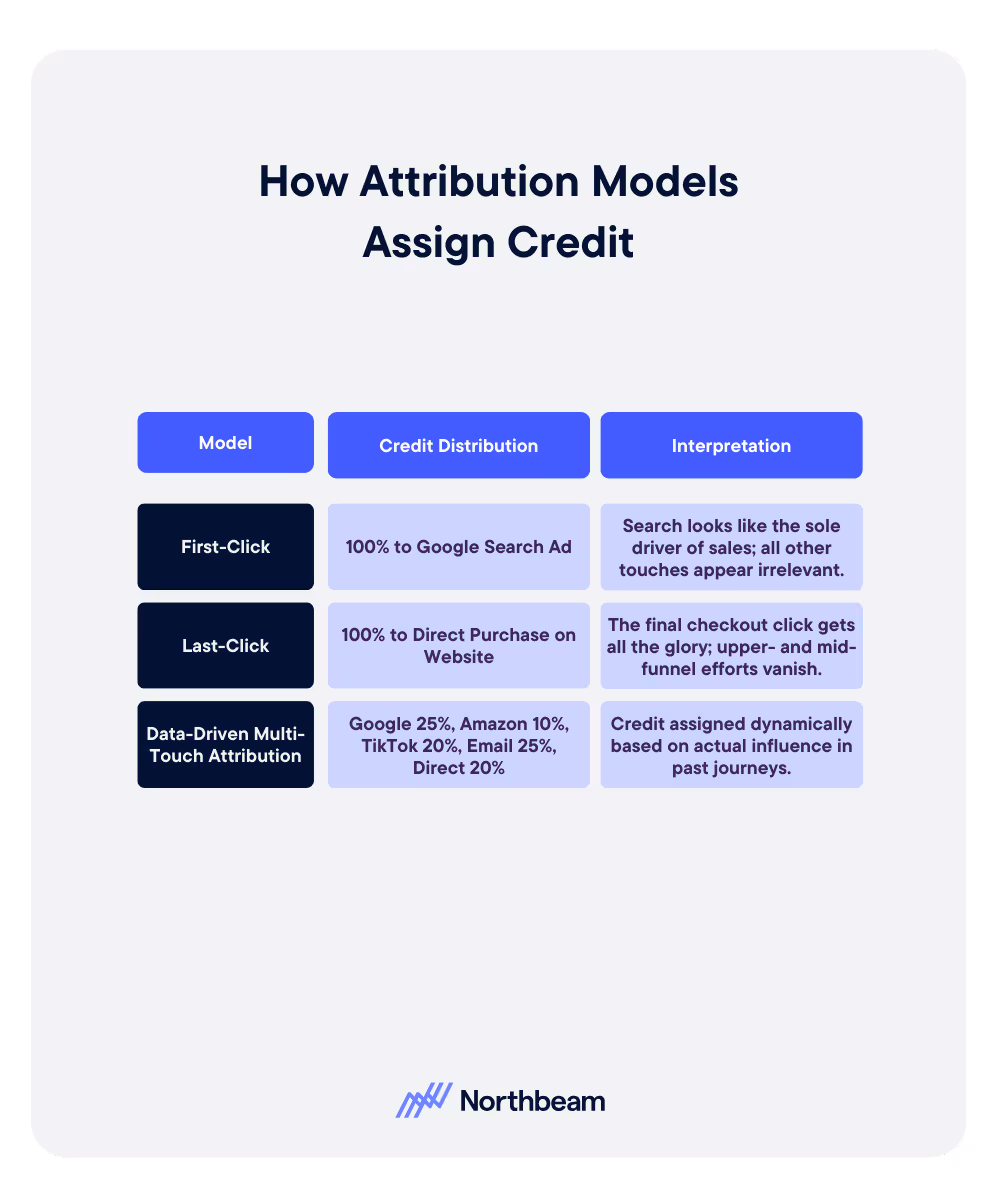
Here’s how first-touch, last-touch, and multi-touch attribution models would show credit differently for the same sale:
Consider the following customer journey:
- A customer first discovers your brand through a Google Search ad
- They browse your products on Amazon but don’t buy anything
- They see a TikTok ad that reminds them of your product later
- They open a discount email and click into your website
- They make a direct purchase on your website
Here’s how different attribution models would assign credit for the same purchase:
In short, MTA matters because it acknowledges marketing for what it really is: a multi-step, multi-channel collaboration.
Types of Multi-Touch Attribution Models
Not all multi-touch attribution (MTA) models are created equal. Each framework takes a different approach to distributing credit across touchpoints.
Choosing the right one depends on your goals, data maturity, and the complexity of your customer journeys.
Here are the most common MTA models, with their advantages, drawbacks, and ideal scenarios:
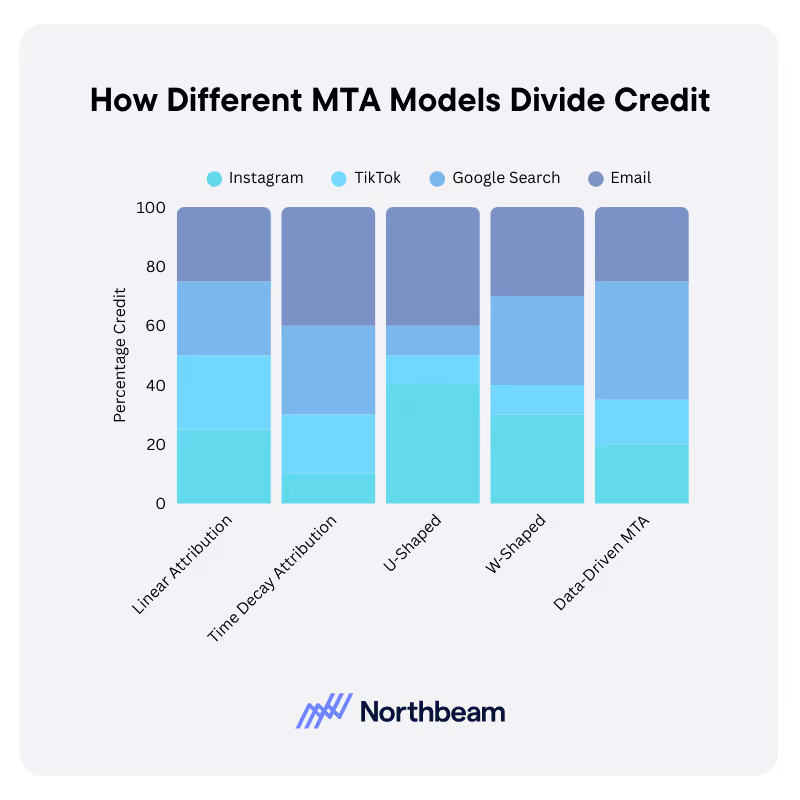
Linear Attribution
- Definition: Credit is divided equally across every touchpoint in the customer journey.
- Pros: Simple to understand and implement; ensures every channel gets recognition.
- Cons: Over-simplifies performance by treating all interactions as equally influential.
- Best For: Brands just starting with MTA, or when you want a “baseline” view of how channels contribute together.
Time Decay Attribution
- Definition: Touchpoints closer to the conversion get more credit, while earlier interactions receive less.
- Pros: Reflects the reality that later-stage actions (like a retargeting click) often have a stronger influence on conversion.
- Cons: Risks undervaluing awareness-building activities; can bias spend toward bottom-of-funnel channels.
- Best For: Shorter sales cycles or campaigns where recency is a reliable indicator of influence.
U-Shaped Attribution (Position-Based)
- Definition: A large portion of credit goes to the first and last touchpoints, with the remainder split among the middle touches.
- Pros: Balances the importance of both awareness (first click) and conversion (last click).
- Cons: Middle touches get minimal recognition, even if they played a critical role in nurturing.
- Best For: Journeys where discovery and conversion are most important milestones, but you still want to capture some mid-funnel activity.
W-Shaped Attribution
- Definition: Similar to U-Shaped, but adds significant credit to a key mid-funnel milestone (such as a form fill or product page view), alongside the first and last touches.
- Pros: Recognizes three critical stages: awareness, lead creation, and conversion.
- Cons: Still assumes a fixed distribution that may not reflect reality for every business.
- Best For: B2B or high-consideration purchases with clear mid-funnel handoffs, such as lead qualification or demo requests.
Algorithmic / Data-Driven Attribution
- Definition: Uses machine learning to dynamically assign credit based on the actual contribution of each touchpoint, leveraging historical and real-time data.
- Pros: Most accurate and customizable; adapts as customer behavior changes.
- Cons: Requires significant data volume and advanced technology; harder to explain to stakeholders.
- Best For: Mature marketing teams with robust data pipelines, complex journeys, and the need for precision.
In practice, no single model is universally “best.”
Many brands start with simpler rules-based models (like Linear or U-Shaped) and evolve toward data-driven approaches as their data capabilities grow.
Single-Touch vs. MTA vs. MMM
Marketers often treat attribution as an “either/or” decision, but in reality, different methods serve different purposes.
Single-Touch Attribution
- What it does: Assigns all credit to the first or last touchpoint.
- Why it’s valuable: Simple to implement, easy to explain to stakeholders, and can provide a quick snapshot of which channels most often open or close conversions.
Multi-Touch Attribution (MTA)
- What it does: Distributes credit across multiple touchpoints to reveal the interplay between channels.
- Why it’s valuable: Offers granular, customer-level insights into what actually drives conversions.
Media Mix Modeling (MMM)
- What it does: Uses aggregated, historical data to measure the overall contribution of each channel to sales.
- Why it’s valuable: Provides a big-picture view of long-term channel effectiveness, including offline and walled-garden channels where user-level data isn’t available.
How Single-Touch, MTA, and MMM Work Together
- MTA is best for tactical optimization: reallocating budget across campaigns and channels in near real time.
- MMM is best for strategic planning: understanding how investments shape growth over months or quarters.
- Single-touch can still be useful as a quick gut-check, but shouldn’t be the only lens you use.
In other words: MTA gives you the microscope, MMM gives you the telescope, and single-touch still has a place as a simple directional compass.
The strongest marketers use all three to see clearly at every level of decision-making.
MTA Challenges and Considerations
While Multi-Touch Attribution can provide unmatched clarity into customer journeys, it’s not without hurdles.
To get reliable insights, marketers need to be aware of the three most common challenges:
1. Data gaps due to privacy restrictions
Regulations like GDPR and CCPA, plus platform policies such as Apple’s App Tracking Transparency (ATT), limit the availability of user-level data.
This makes it harder to connect every touchpoint and can leave blind spots in attribution models.
2. Cross-device attribution issues
Customers rarely stay on a single device: they might click an ad on mobile, research on a laptop, and convert later on a tablet.
Without strong identity resolution, these multi-device journeys can look like separate users, distorting credit assignment.
3. Model selection pitfalls
No model is perfect. Choosing the wrong one for your business can either overcomplicate analysis or lead to misleading conclusions.
For example, relying on time-decay in a long B2B sales cycle may undervalue top-of-funnel touches that actually drive momentum.
The key takeaway: MTA delivers immense value, but its effectiveness depends on high-quality data, thoughtful model selection, and the right technology to close gaps.
How to Implement MTA Effectively
Getting Multi-Touch Attribution right isn’t just about picking a model, it’s about building the right foundation and using the right tools.
Here are the four core steps to make MTA successful:
1. Set clear goals
Define what you want to learn: Are you optimizing budget allocation? Testing new channels? Improving ROI visibility?
Specific objectives ensure your attribution framework delivers actionable insights.
2. Ensure data integrity
Clean, consistent, and complete data is the lifeblood of MTA.
Make sure you’re capturing touchpoints across all channels, including web, email, paid, organic, and offline interactions.
3. Choose the right platform
Attribution is too complex to manage manually. Advanced platforms like Northbeam bring automation, accuracy, and scale to the process.
Unlike generic analytics tools, Northbeam connects performance across the entire funnel, unifies cross-channel data, and adapts to the privacy-first future.
4. Validate and refine
No model is “set and forget.” Regularly compare attribution insights with business outcomes to ensure accuracy.
Iterate as your customer journey evolves; what works for one campaign or season may not apply to the next.
With clear objectives, clean data, and the right technology, MTA becomes more than a reporting tool: it becomes a growth engine.
Making Multi-Touch Attribution Work for You
In a world where customer journeys span dozens of channels and devices, accurate attribution is no longer optional, it’s essential.
Multi-Touch Attribution (MTA) provides the clarity that single-touch models lack, ensuring every stage of the funnel gets the recognition it deserves.
The right model depends on your goals:
- Linear for simplicity
- Time Decay for recency
- U- and W-Shaped for milestone-driven journeys
- Algorithmic approaches for precision at scale.
What matters most is choosing strategically and evolving as your marketing matures.
With a thoughtful approach, and advanced platforms like Northbeam to streamline the process, MTA becomes more than a measurement tool. It becomes the foundation for smarter decisions, stronger customer experiences, and more efficient growth.


.avif)


%25201.avif)


.avif)


.svg)
