Blog

The Explore–Exploit Cycle of Meta’s Algorithm

Why Meta’s algorithm makes performance swing — and how to ride the cycle instead of panicking through the dips.
The Explore Exploit Cycle Of Meta's Algorithm

TL;DR

  • Performance swings are a natural part of how the system works.
  • Short-term drops don’t mean something is broken.
  • Looking at longer time horizons gives a clearer picture.
  • Consistent investment through cycles leads to sustainable growth.

One of the most confusing things for advertisers on Meta is why performance seems to swing up and down for no obvious reason. One week your ROAS is incredible, the next week it feels like the account fell off a cliff. Most advertisers assume something’s broken — maybe a creative wore out, maybe the bidding changed, maybe the pixel isn’t firing.

But more often than not, what you’re seeing is simply the Explore–Exploit cycle of Meta’s ad algorithm at work. Understanding this cycle is critical if you want to scale without panic.

What the Explore–Exploit Cycle Means

At its core, Meta’s delivery system is both a search and an exploit algorithm.

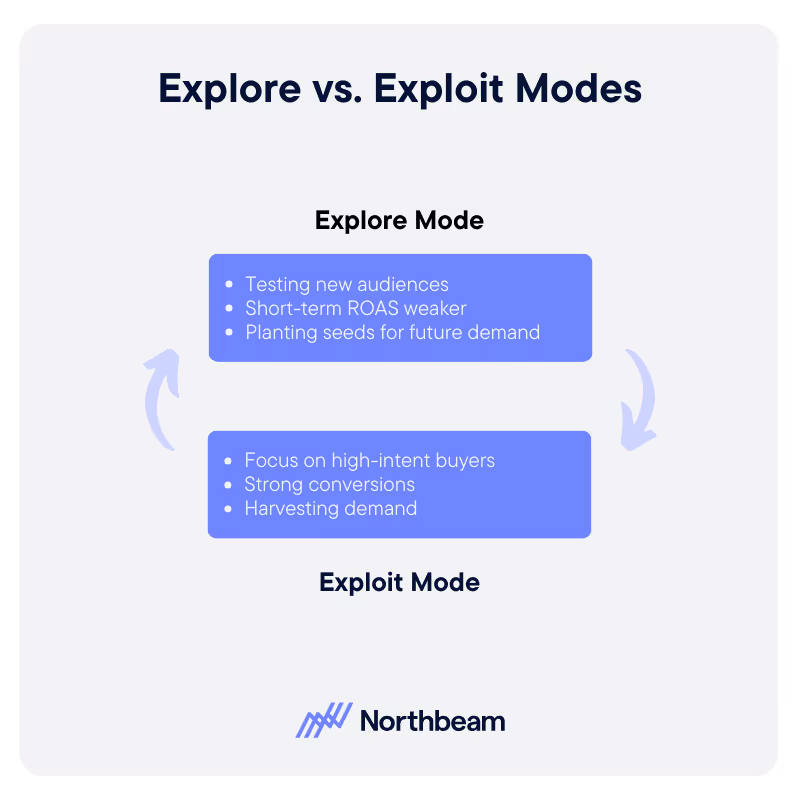
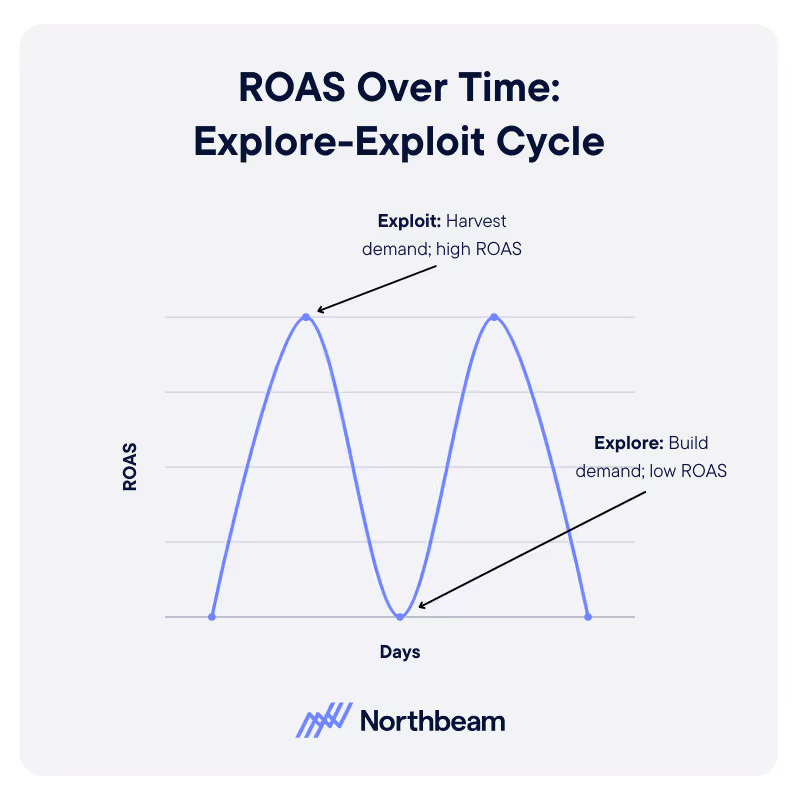
  • Explore mode: The system invests budget to go out and find new people, many of whom aren’t yet ready to buy. During this phase, ROAS will usually look weaker because you’re building demand, not harvesting it.
  • Exploit mode: Once Meta identifies high-intent buyers, the system leans hard into them. Performance spikes, conversion rates look fantastic, and you might feel like you’ve hit a new permanent level.

Then, just as suddenly, things dip again — because you’ve harvested that pocket of demand and the system goes back into Explore mode.

Why This Feels Like a Roller coaster

For advertisers who only look at day-to-day ROAS, these cycles can feel like chaos. I can’t tell you how many times a client has called me after three poor days in a row, convinced something’s broken. In reality, nothing’s wrong. The system is just back in Explore mode, doing the slower work of creating new demand.

The key is zooming out. Depending on your product’s average order value and sales cycle, it may take 7 to 14 days before the demand you planted during Explore mode actually shows up in conversions.

A Real-World Example

We worked with a home goods brand that had an average order value of around $1,000. Their account was shut down for a week due to a billing issue. During that pause, sales looked great — because they were still reaping demand planted by the ads that had run the week prior.

But the week after turning ads back on? Atrocious performance. Why? Because that pipeline had dried up during the pause. It took another full week of Explore spending before sales stabilized again.

That’s the Explore–Exploit cycle in action. If you’d pulled the plug after that “bad” week, you’d never give the algorithm the time it needs to rebuild demand.

How to Manage the Cycle Without Panic

  1. Measure in Weeks, Not Days
    Look at 7–14 day trends instead of reacting to daily fluctuations. This smooths out the natural oscillations.
  2. Know Your Customer Journey
    If your product sells on first touch (like a $20 impulse buy), the cycle is shorter. If it’s a $1,000 purchase, the cycle is longer. Set expectations accordingly.
  3. Don’t Overreact to Dips
    When you hit a bad week after a great one, remind yourself: this is the system exploring, not failing. Pulling back budgets too soon just starves future growth.
  4. Balance Demand Creation and Harvesting
    Use prospecting campaigns to fuel Explore mode and retargeting to maximize Exploit mode. Both are necessary — ignore one and the other collapses.

The Bigger Picture

The Explore–Exploit cycle is baked into Meta’s DNA. It’s not a bug, it’s a feature. The system is constantly searching for new buyers and then doubling down on them once it knows who they are.

The advertisers who thrive are the ones who trust the process, ride out the valleys, and plan their strategies around the cycle instead of fighting it.

If you accept that volatility is normal, you stop chasing ghosts in your data and start focusing on the fundamentals: reach, frequency, creative, and consistent investment.

Closing Thoughts

Great weeks don’t last forever, and neither do bad ones. Meta’s algorithm is always oscillating between exploration and exploitation. The trick is not to panic when the pendulum swings.

If you can zoom out, understand the rhythm, and keep your budgets steady through the cycle, you’ll find that your account builds new baselines over time — and that’s how real, sustainable growth happens.

Continue Reading

what-is-gclid-complete-guide-to-google-click-identifier

What Is GCLID? Complete Guide to Google Click Identifier

Learn what GCLID is, how it works, and why it’s essential for accurate Google Ads tracking.
beyond roas fundamentals of advertising hero

Beyond ROAS: Fundamentals of Advertising In 2025

Why relying on ROAS alone can stunt growth—and the metrics that reveal if your ads are truly building a brand.

iOS 26 Won’t Kill Your UTMs – Here’s Proof

Despite headlines warning of doom, our testing shows iOS 26 leaves Northbeam’s UTMs untouched.
what-is-fcblid-guide-to-facebook-click-identifiers-and-tracking-ad-performance

What is fbclid? A Complete Guide to Facebook Click Identifiers and Tracking Ad Performance

This small URL parameter powers big improvements in Meta ad attribution

What Is Data-Driven Marketing? A Complete Guide to Transforming Your Marketing Strategy with Data

Leverage data to improve your marketing strategies

Why You Should Care About MTA, MMM, and Incrementality

Transform Your Marketing Performance
A futuristic cityscape with a glowing digital figure and a person studying analytics, symbolizing insights into Return on Ad Spend and mastering return on ad spend, with the Northbeam logo and text overlay.

What Is ROAS? A Beginner’s Guide to Return on Ad Spend

Learn why ROAS matters and how to maximize your returns
What makes Northbeam data different

What Makes Northbeam Data Different?

Not All Data is Created Equally

What to Expect When Switching to Northbeam

Everything You Need to Know When You Try Out Northbeam
Illustration of pixel tracking concept with magnifying glass over mechanical gears, symbolizing data analysis, and Northbeam logo in the top corner. Text reads: 'What is Pixel Tracking?

What is Pixel Tracking?

Unlock the Power of Pixel Tracking for Better Marketing Insights
What is Multi-Touch Attribution (MTA)?

Multi-Touch Attribution Models: A Complete Guide to Measuring Every Marketing Touchpoint

Understand, compare, and implement MTA for smarter marketing measurement

What is Media Mix Modeling (MMM)?

Wondering what exactly comprises Media Mix Modeling? Get a comprehensive overview of MMM

What is Marketing ROI and How Can You Improve It?

Understand and enhance your marketing ROI
Image of a man utilizing applovin on his phone and measuring the impact of his adds using Northbeam, the multi touch attribution solution for profitable growth

What is AppLovin and How to Leverage it For Marketing Success

Why DTC brands are flocking to AppLovin, and how to make it work for you

What is Marketing Intelligence Software?

Capture the right data for informed marketing decisions
This highlights key marketing metrics with a creative scene of a strategist building a futuristic ship, symbolizing innovation and long-term success strategies, with the Northbeam logo and text overlay.

Top Marketing Metrics to Track for Long-Term Success

Track these essential metrics to drive sustainable growth

What Is Incrementality In Marketing? A Guide to Measuring True Campaign Impact

The Critical Role of Attribution Models in Unlocking Growth
Northbeam presents a marketer’s guide to customer journey mapping, featuring a relaxed professional at a desk, symbolizing strategic planning and marketing success.

The Marketer’s Guide to Customer Journey Mapping

A five-step, strategic approach to customer journey mapping

The Future with YouTube Advertising

Navigating rising digital ad costs with Northbeam

The Marketer’s Guide to AI

How modern marketers can best harness the power of AI
Super Bowl Football Field with the Super Bowl logo and Northbeam logo sitting on the 50 yard line

Super Bowl 2025 Advertising Trends & Performance Analysis

The Big Game, Big Spends, and Even Bigger Marketing Moves

Performance Benchmarks: Black Friday Cyber Monday 2023

A look into this year's performance compared to last year.

Serious Data For Serious Growth: How Northbeam Enables HexClad To Stay Efficient with Scale

Leveraging Northbeam for scalable efficiency

The 2024 Guide to Incrementality

A guide to measuring marketing impact

Northbeam's Definitive Guide to Q5 2025

A Northbeam guide to the "hidden" fifth quarter
Abstract illustration showcasing individuals standing on interconnected platforms with glowing gears, representing probabilistic and deterministic approaches in a cookieless future, with the Northbeam logo and text overlay.

Probabilistic vs. Deterministic Attribution Approaches In a Cookieless Future

Combine probabilistic and deterministic models for future-proof attribution

How Will Cookie Deprecation Affect Northbeam? An Explainer

Northbeam's resilience amid third-party cookie deprecation
Northbeam showcases a futuristic city with holographic figures, drones, and digital interfaces, guiding ecommerce brands on Meta's new sensitivity category restrictions.

Meta’s Sensitivity Category Restrictions: A Guide for Ecommerce Brands

How to get to grips with Meta's privacy restrictions

Beyond Walled Gardens: How Marketers Can Thrive in a Fragmented Digital Landscape

Embrace open web strategies in the evolving digital ad landscape
How to Not Get Fired: A 5-Step Guide for CMOs

How To Not Get Fired: A 5-Step Guide for CMOs

Secure your role amid a shifting marketing landscape

Media Mix Modeling (MMM): Build or Buy?

Evaluating the best approach to implementing MMM

Marketing Efficiency Ratio (MER): Definition, Benchmarks, and How it Differs from ROAS

Use MER and ROAS Together for Smarter Decisions
Northbeam is powered by AI, and so will you.

How does Northbeam use AI?

Northbeam's advanced ML models enhance marketing performance
Cost per clicks

Do Cost Per Clicks Matter?

Evaluating the significance of CPC in performance marketing

Google Chrome Won’t be Deprecating Cookies — Yet

Google's decision to retain third-party cookies, and what it means for you
Utm Tracking 101 How To Use Utm Parameters To Measure Campaigns

UTM Tracking 101: How to Use UTM Parameters to Measure and Improve Campaign Performance

Learn how to use UTM parameters to track campaign performance, improve attribution, and optimize ROI with this step-by-step guide for marketers.
Northbeam presents Black Friday and Cyber Monday 2024 predictions and performance with a futuristic digital sphere, symbolizing data-driven insights and analysis.

BFCM 2024 Predictions: How Did We Do?

Wins, surprises, and lessons for 2025
Northbeam presents a seamless omnichannel marketing strategy with a historical meeting room and futuristic digital elements, symbolizing innovation and best practices.

Creating a Seamless Omnichannel Marketing Strategy: Tips & Best Practices

Mastering Omnichannel Marketing by creating a Seamless, Data-Driven Customer Journey
Northbeam highlights customer retention with an elegant historical setting, symbolizing long-term relationships and why retention should be every marketer’s priority.

Beyond Acquisition: Why Retention Should Be Every Marketer’s Priority

Shifting Focus: Why Retention Is the Key to Sustainable Growth and Profitability
Company Northbeam creates an ad spend optimization with a vintage airplane in a high-tech workshop, symbolizing innovation and maximizing Return on Investment from every marketing dollar.

Ad Spend Optimization: How to Get More ROI from Every Marketing Dollar

Stop Wasting Ad Spend: How Smarter Strategies and Tools Can Maximize ROI
Futuristic laboratory scene with advanced technology screens, DNA graphics, and a scientist analyzing data, representing innovation strategies for return on investment with Northbeam during economic uncertainty, with the Northbeam logo and text overlay.

5 Strategies to Maximize ROI During Economic Uncertainty

Use data-driven techniques to thrive during challenging times
a vibrant digital marketing control room with gears, graphs, and data screens, illustrating insights from a beginner's guide to marketing attribution, with a Northbeam logo and overlay.

A Beginner’s Guide to Marketing Attribution

Learn what marketing attribution is and how to harness its power in an ever-changing digital landscape
Northbeam is the perfect tool for performance marketing agencies.

5 Reasons Why Northbeam is the Perfect Tool for Performance Marketing Agencies

The Last Thing You Should Worry About Is Accurate Data

Accounting Modes 101: What Marketers Need to Know

Understanding cash snapshot and accrual performance modes

2025 Marketing Trends to Watch Out For: Part 2

CTV growth, evolving search, nano-influencers, and data privacy

2025 Marketing Trends to Watch Out For: Part 1

Navigating a Shifting Landscape of Generative AI, Social Media, and Data Privacy

It's time to take your marketing

to the next level.

Chat with our team and discover how Northbeam can transform your business.
book a demo