


Ever felt like you’re throwing money at ads and just hoping something sticks?
Without a clear picture of return on ad spend (ROAS), it’s hard to tell what’s working, and what’s just burning cash.
ROAS, or Return on Ad Spend, is a simple but powerful metric that shows how much revenue you earn for every dollar you spend on advertising.
Whether you're running Meta campaigns or multi-channel growth programs, ROAS helps you evaluate ad efficiency and make smarter budgeting decisions.
In this guide, we’ll break down exactly what ROAS is, how to calculate it, what a “good” ROAS looks like, and how to improve it.
We’ll also explore common mistakes marketers make when tracking ROAS, and how to avoid them.
What is ROAS, and how can you calculate it?
ROAS measures the revenue generated for every dollar spent.
It’s a straightforward metric that helps marketers understand whether their campaigns are profitable and which channels deliver the best results.
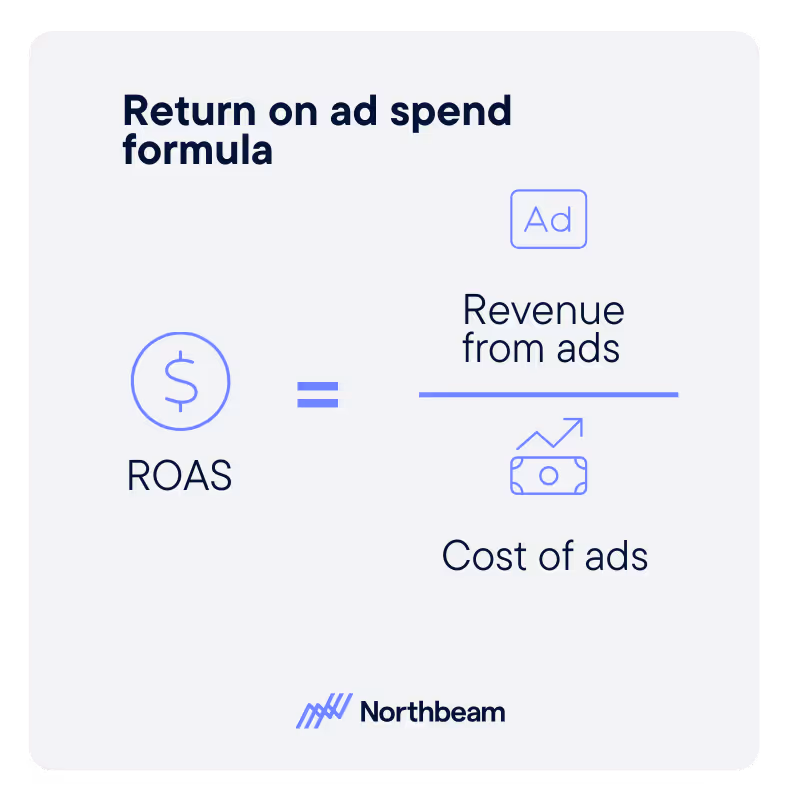
The ROAS formula is calculated simply as Revenue divided by Ad Spend:
ROAS = Revenue / Ad Spend
For example, if your Revenue is $10,000 and your Ad Spend is $2,500, your ROAS would be:
ROAS = $10,000 / $2,500 = 4.0.
In this example, your advertising ROAS is $4 in revenue for every $1 spent.
While calculating the ROAS formula is simple enough, it’s critical to ensure that you’re using the right inputs. Make sure to accurately determine your revenue during a specific period. This could include direct purchases, sign ups, or other types of conversions.
Then, make sure you’re accurately calculating ad spend. Add up all the costs associated with a given campaign, including media buys, creative production, and management fees.
Why does ROAS matter?
ROAS is one of the clearest indicators of whether your marketing dollars are actually delivering results.
Here’s why it matters:
- Profitability check: ROAS shows you whether your ad spend is generating more revenue than it costs. If you’re spending $2,500 and making $10,000, that’s a 4x ROAS — and a strong sign of profitability.
- Budget optimization: By comparing ROAS across different campaigns or channels, you can identify where to allocate more budget for maximum returns.
- Strategic decision-making: A high ROAS indicates profitable campaigns, while a low ROAS signals the need for optimization or a re-evaluation of your strategy.
- ROI proof: Tracking ROAS consistently helps you refine your approach, bring data to the conversation, and improve your overall advertising ROAS.
How and when is ROAS used?
In modern marketing, ROAS is more than a performance metric: it’s a decision-making tool.
Marketers use ROAS to evaluate campaign efficiency, shift spend to high-performing channels, and justify budget increases (or cuts) with real numbers.
Marketers use ROAS for:
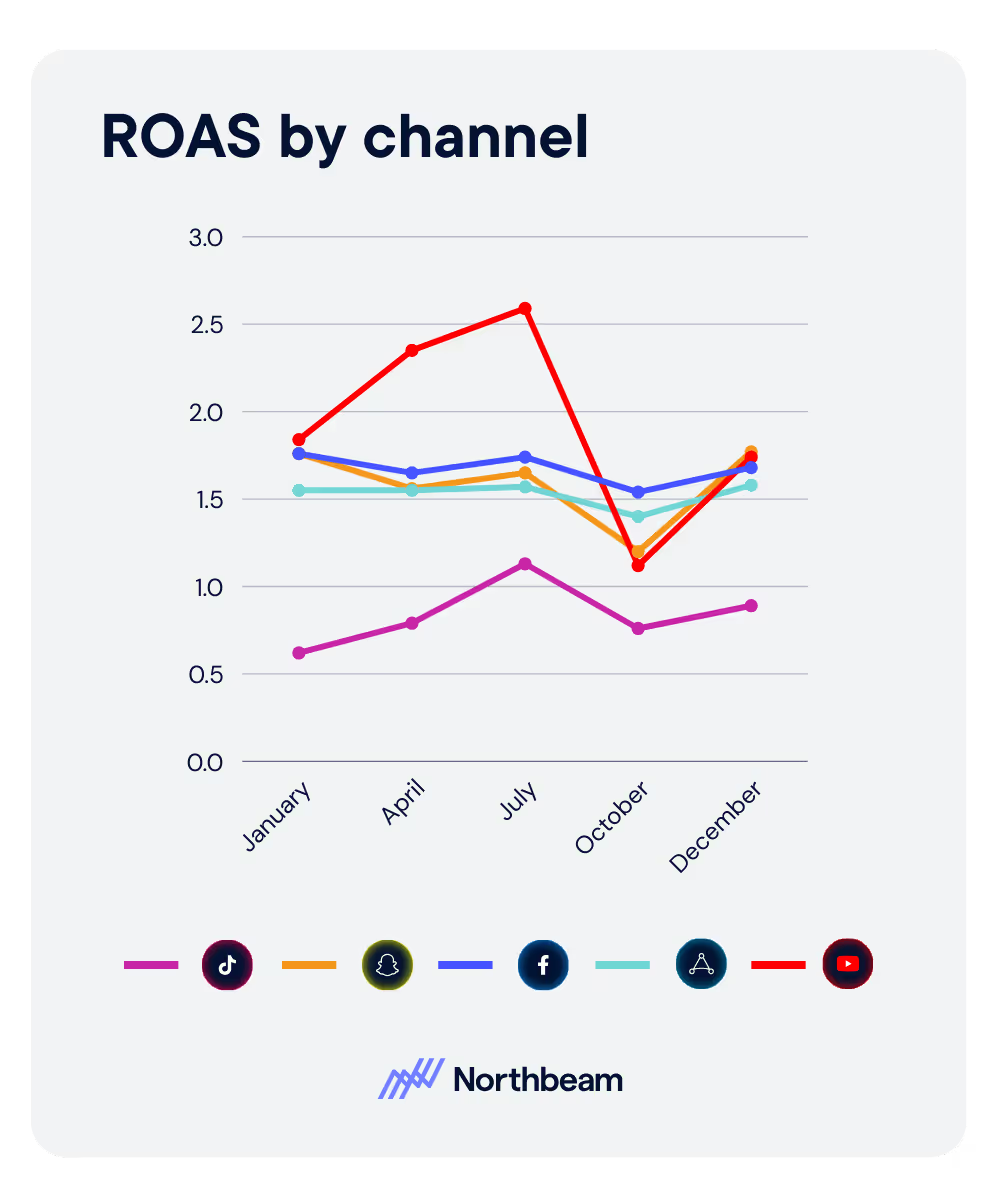
- Channel planning: Comparing ROAS across platforms helps teams assess which channels are truly worth the investment. Paid search might drive conversions efficiently, while paid social delivers awareness but lower ROAS.
- In-flight optimization: Running Meta, Google, or TikTok ads? Marketers often monitor ROAS daily or weekly to reallocate spend in real time, turning down underperforming campaigns and doubling down on the winners.
- Post-campaign analysis: After a campaign ends, ROAS is a quick way to assess whether it met revenue expectations — and whether it’s worth repeating.
What is a good ROAS benchmark?
ROAS isn’t one-size-fits-all.
What qualifies as a good ROAS benchmark depends on your industry, business model, channel, margins, and sales cycle.
Here’s how different industries approach good ROAS benchmarks — and why their acceptable ranges vary.
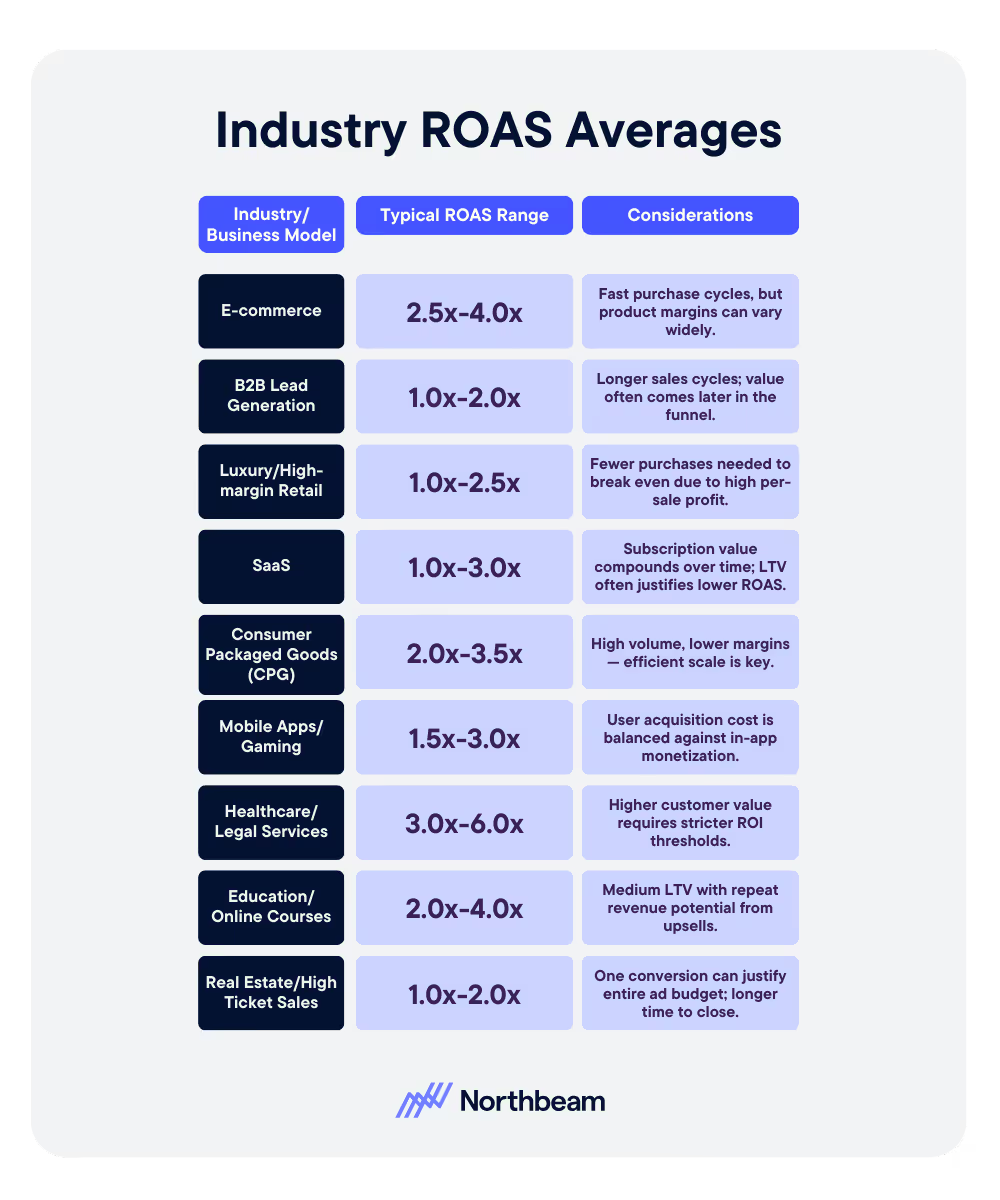
Understanding where your business fits on the ROAS benchmark spectrum helps you set smarter performance targets and avoid apples-to-oranges comparisons.
Whether you’re aiming for a 4x return or making strategic bets on long-term value, ROAS is most powerful when used in context.
How can you best apply ROAS?
Knowing your return on ad spend is only half the battle: the real power comes from using it to guide your ROAS marketing strategy.
Track the Full Picture
To apply ROAS effectively, you need more than just ad spend and top-line revenue. True ROAS depends on accurate tracking of:
- All associated costs: including creative production, agency fees, platform commissions, and even fulfillment if relevant.
- Attribution data: so you know which clicks, impressions, or channels actually contributed to a sale.
Without clean attribution and comprehensive cost tracking, your ROAS may look better (or worse) than it really is, leading to poor decisions.
Automate with the Right Tools
Manual ROAS tracking is time-consuming and prone to error, especially if you’re running campaigns across multiple platforms like Meta, Google, TikTok, and email.
That’s where tools like Northbeam come in. Northbeam automates ROAS calculation using first-party data, cross-channel attribution, and full-funnel insights — helping you see exactly which ads are driving real revenue, not just clicks.
With better visibility, you can:
- Identify your most efficient campaigns
- Pinpoint low-performing spend
- Reinvest confidently for higher returns
What are some common ROAS mistakes and misconceptions?
ROAS is a powerful metric, but it’s only as accurate as the data behind it — and it doesn’t tell the whole story on its own.
To make smart, high-confidence decisions, avoid these common ROAS pitfalls:
Ignoring multitouch attribution
Many marketers rely on a single-touch attribution model, which gives full credit to the last ad a customer interacted with before converting.
But in reality, most customer journeys are multitouch, spanning multiple platforms and touchpoints.
If you ignore that complexity, you risk undervaluing top-of-funnel campaigns or key supporting channels.
Instead, advanced attribution models — like linear, time decay, or data-driven — offer a more holistic view.
Platforms like Northbeam make it easier to apply these models and accurately track ROAS across the full customer journey.
Over-focusing on ROAS
ROAS can show you whether an ad is generating revenue, but it doesn’t reveal whether those customers will stick around.
A campaign with a high ROAS might bring in low-quality, one-time buyers, while a campaign with lower immediate returns could be acquiring loyal, high-LTV customers.
That’s why it’s important to balance ROAS with other metrics like Customer Lifetime Value (CLV) and Customer Acquisition Cost (CAC) to get a more complete picture of marketing effectiveness.
Overlooking hidden costs
If you’re only factoring in platform spend and ignoring expenses like agency fees, creative production, influencer partnerships, or software tools, your ROAS calculations may be overly optimistic.
To get a true measure of profitability, make sure you’re including all relevant costs in your formula — not just what’s visible in your ad dashboard.
Confusing ROAS vs ROI
While they’re both return metrics, ROAS only measures the revenue generated per advertising dollar spent.
ROI, on the other hand, takes into account all costs, not just ad spend, and calculates net profit.
A campaign can have a high ROAS and still lose money from an ROI perspective once fixed and variable costs are factored in.
A clear, accurate understanding of ROAS, and an understanding of the difference between ROAS vs ROI, is essential for evaluating true business impact and long-term growth potential.
How can you improve ROAS?
Once you’re tracking ROAS accurately, the next step is to improve it.
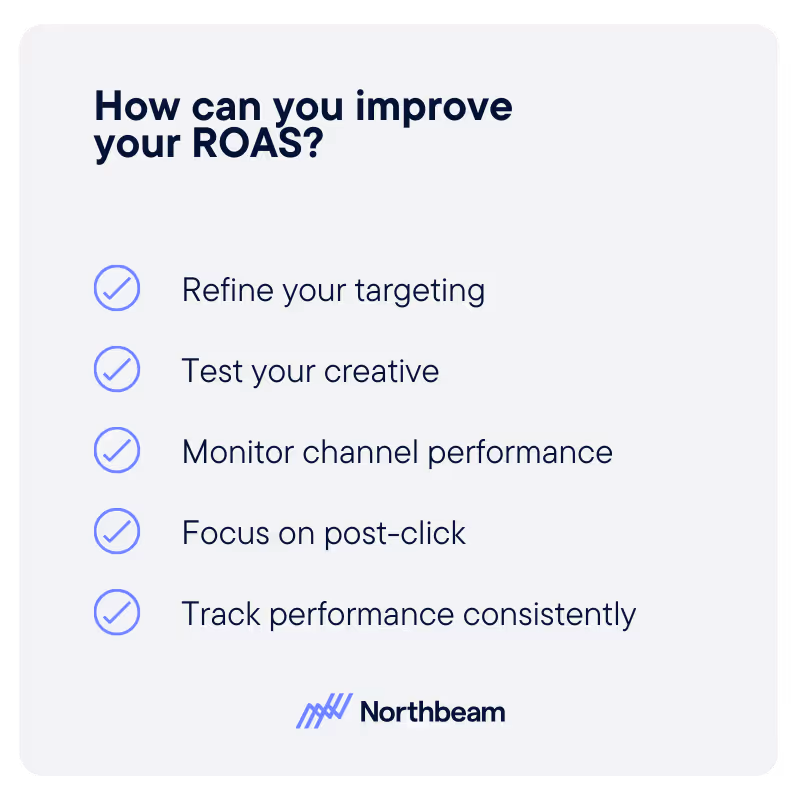
Whether you're optimizing for efficiency or scaling what already works, here are five proven strategies that can help lift your return on ad spend.
1. Refine your targeting
Use detailed audience segmentation and lookalike modeling to reach people who are more likely to convert, not just click.
Smart targeting ensures your budget is going toward the audiences with the highest potential ROI.
2. Test your creative
A/B testing headlines, visuals, calls to action, and formats across platforms can lead to meaningful gains in conversion rates and ROAS.
Even small improvements in engagement or relevance can have a big impact when scaled.
3. Monitor channel performance
Continuously compare ROAS across channels and campaigns to identify what’s working.
Shift budget toward high-performing channels and pause or restructure underperformers to prevent wasted spend.
4. Focus on post-click
If your landing pages aren’t converting, even the best campaigns won’t deliver advertising ROAS.
Streamline your pages for speed, clarity, and ease of conversion — especially on mobile, where friction can quickly kill ROAS.
5. Track performance consistently
The best way to improve ROAS is to measure it often, and act on the insights.
With platforms like Northbeam, you can monitor ROAS in real time, identify patterns across the funnel, and make data-backed decisions with confidence.
ROAS in Action: MyHD
Learn how MyHD improved their ROAS by +84% with data-driven decision making, enabled by Northbeam.
MyHD DJ Store faced difficulty identifying which marketing channels delivered the best returns, leading to inefficiencies in ad spend.
Northbeam's platform provided MyHD with accurate, actionable insights by consolidating first-party data and offering advanced attribution models.
MyHD achieved an 84% improvement in blended ROAS, a 21% reduction in customer acquisition costs, and optimized marketing efficiency.
Make ROAS work for you
ROAS, or Return on Ad Spend, is one of the most critical metrics for understanding whether your marketing is truly working.
It helps you measure campaign efficiency, optimize budget allocation, and tie revenue back to ad spend.
By calculating ROAS accurately, comparing it to industry benchmarks, and applying smart optimization tactics, you can make more confident, data-driven decisions.
But tracking ROAS manually, especially across multiple channels and touchpoints, can be time-consuming and error-prone.
Explore how Northbeam provides real-time ROAS tracking, cross-channel attribution, and actionable insights that help marketers scale what works, and cut out what doesn’t.


.avif)


%25201.avif)


.avif)


.svg)
