


The products that thrive aren’t just the ones people try once, they’re the ones people return to again and again.
Habitual usage is the strongest signal of loyalty, product market fit, and long-term growth.
If your app, platform, or tool becomes part of a user’s daily rhythm, you’ve built something far more powerful than short-term popularity.
User stickiness, defined simply as the ratio of Daily Active Users (DAU) to Monthly Active Users (MAU), measures how often your customers engage with your product on a regular basis.
A higher percentage signals stronger habitual engagement and a greater likelihood that your product will retain users, monetize effectively, and scale sustainably.
In this article, we’ll break down exactly what user stickiness is, why it matters, how to measure user stickiness, and proven strategies to improve it. We’ll also cover implementation tips to ensure your data is accurate and actionable.
By the end, you’ll have a clear playbook for making your product not just popular, but sticky.
What Is User Stickiness
At its simplest, user stickiness is a way of measuring how often your customers keep coming back.
Stickiness vs. Retention
As we define this key metric, it’s important to distinguish stickiness from retention.
Retention shows whether a user keeps coming back over time; think of it as continuity. Stickiness, on the other hand, captures frequency: how regularly users engage once they’ve signed up.
A product can have strong retention but low stickiness if people only log in occasionally, or high stickiness but poor retention if usage is intense but short-lived.
Together, these two metrics tell a more complete story of engagement.
Why User Stickiness Matters
From a business perspective, stickiness is powerful because frequent engagement compounds value.
Users who return daily or weekly are more likely to:
- Stay loyal and less likely to churn.
- Discover and use more features, which increases monetization opportunities.
- Deliver better ROI on acquisition spend, since converting them yields longer-term payoff.
In other words, stickiness doesn’t just show how popular your product is, it shows whether it’s embedded in your users’ routines, which is the real driver of sustainable growth.
How to Measure User Stickiness
The most widely used way to measure user stickiness is through the Daily Average Users (DAU) / Monthly Average Users (MAU) ratio, also known as the DAU/MAU stickiness ratio.
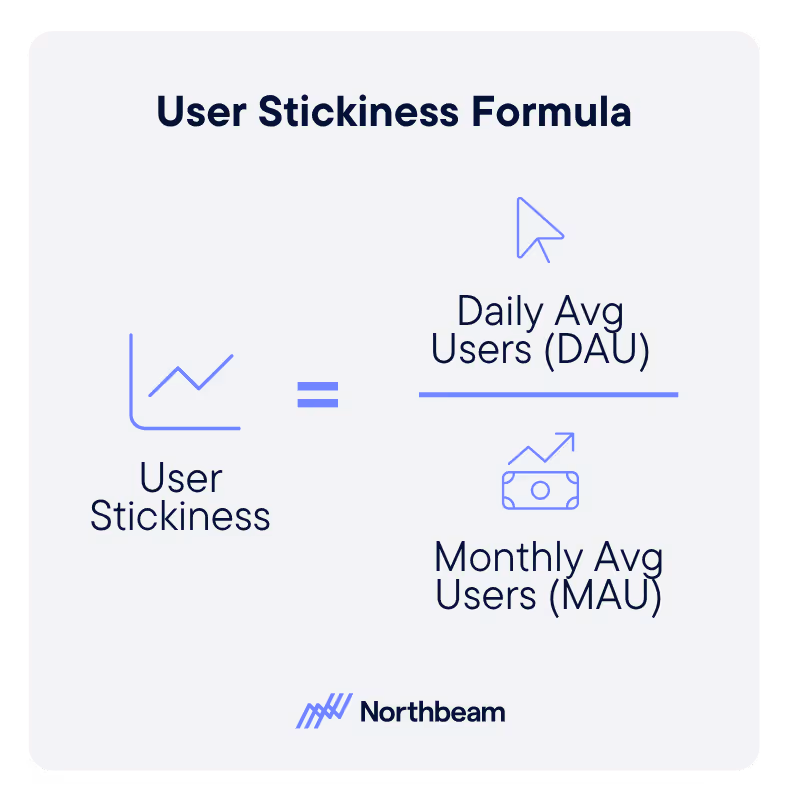
Stickiness ratio = DAU ÷ MAU
For example, if you have 5,000 DAU and 20,000 MAU, your stickiness is 25%. That means one in four of your monthly users engage with your product on a daily basis, a strong sign of habitual usage.
While DAU/MAU is the standard, it’s not the only option. Depending on your product and usage cycle, you may want to track:
- WAU/MAU (Weekly Active Users ÷ Monthly Active Users) to capture weekly engagement patterns.
- Cohort analysis, which groups users by signup date or acquisition channel and tracks how their stickiness changes over time. This can help you see whether new features or campaigns improve frequency of use.
To track these ratios, most teams rely on a mix of analytics and business intelligence (BI) tools.
Popular options include:
- Google Analytics 4 (GA4) for top-level reporting.
- Custom dashboards that integrate DAU and MAU data from multiple sources.
- BI platforms like Looker, Tableau, or Mode for deeper analysis and visualization.
The key is to choose a measurement approach that reflects your product’s natural usage cadence and provides consistent, comparable data over time.
Stickiness Benchmarks By App Type
So what counts as “good” stickiness? The answer depends heavily on your industry.
Different types of apps naturally invite different usage cadences:
- Social and messaging apps: 50-80%. Users often check in multiple times per day, so these products typically see the highest stickiness ratios.
- Productivity tools: 40–60%. Daily work habits drive strong engagement, but usage may taper on weekends or holidays.
- Fintech and e-commerce apps: 15–30%. People don’t manage finances or shop every day, so stickiness is lower, but still meaningful when compared to peers.
These ranges offer helpful context, but it’s important not to treat them as hard rules. Upward movement in your own numbers is usually more valuable than hitting an external target.
For example, a fintech app with a stickiness rate growing from 12% to 20% is often in a stronger position than one stuck at 25%.
To make benchmarks actionable, start by establishing your internal baseline (what’s typical for your product today) and then measure progress against that.
External comparisons should serve as guardrails, not goals, to help you calibrate expectations and spot opportunities for improvement.
Key Drivers of User Stickiness
If stickiness shows how deeply your product is woven into users’ routines, the natural question is: what makes people come back again and again?
While every product is different, a few common drivers tend to make the biggest impact:
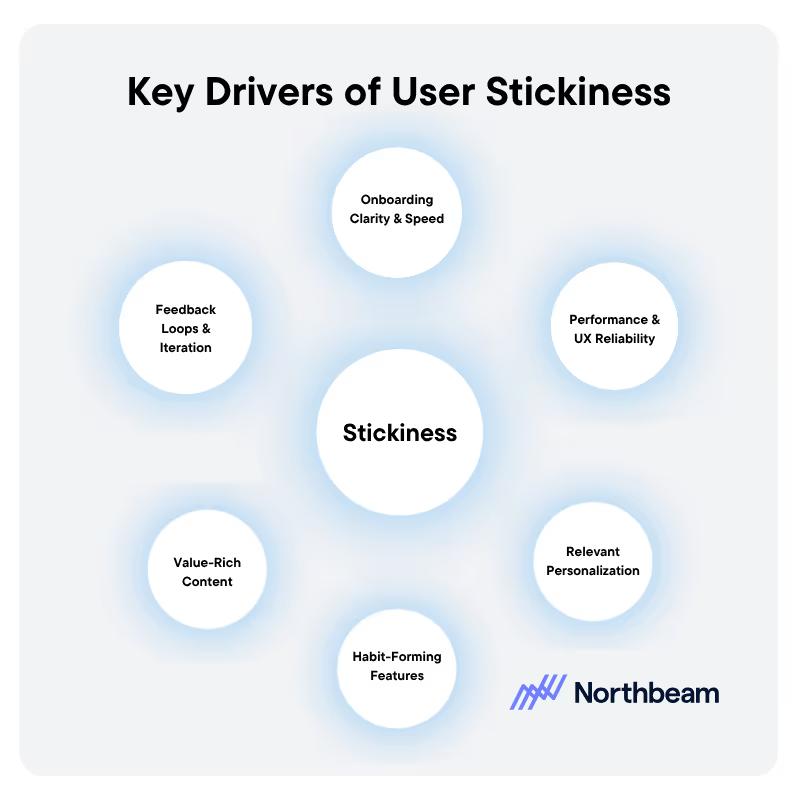
Onboarding Clarity and Speed
First impressions matter.
A confusing or drawn-out onboarding flow can derail new users before they ever form a habit. Quick wins and early exposure to value are critical.
Performance and UX Reliability
People won’t return if your product is slow, buggy, or unintuitive. Smooth, reliable performance is table stakes for building trust and repeat usage.
Relevant Personalization
Customized recommendations, tailored dashboards, or context-aware reminders help your product feel indispensable rather than generic.
Habit-Forming Features
Streaks, reminders, daily dashboards, or other lightweight nudges create rhythms that encourage users to return at predictable intervals.
Value-Rich Content or Functionality
Ultimately, people stick around for utility. Whether it’s fresh content, powerful features, or unique insights, the core value needs to keep evolving.
Feedback Loops and Iteration
Products that improve based on user feedback reinforce the sense that engagement leads to a better experience, which in turn drives more engagement.
Together, these drivers create a reinforcing cycle: onboarding unlocks early value, performance and personalization sustain it, and habit-forming features plus ongoing improvements deepen loyalty over time.
Strategies to Boost Stickiness
Once you know where your product stands, the next step is figuring out how to move the needle.
Improving user stickiness isn’t about one big initiative. It’s about layering small, targeted improvements that make your product more engaging over time.
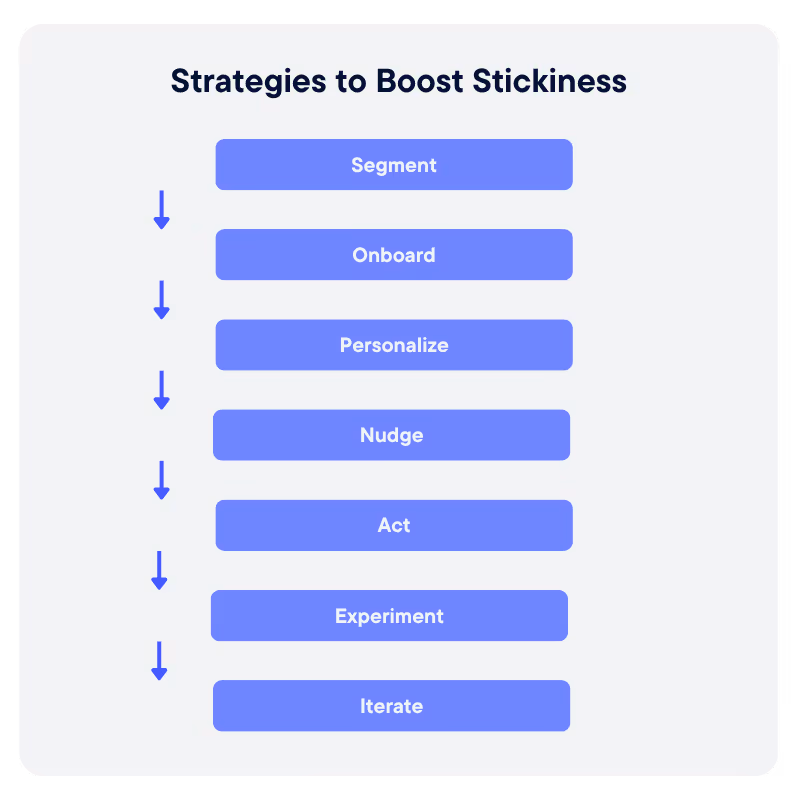
Here are some of the most effective tactics:
Segment Your Users
Not all customers behave the same way. Segmenting by behavior, persona, or lifecycle stage allows you to tailor messaging, features, and nudges for maximum relevance.
Streamline Onboarding
Help new users find value fast. Highlight “aha” moments early so they form a habit before friction or confusion sets in.
Personalize Content and Reminders
Personalize content and reminders – Use behavioral data to deliver timely notifications, recommendations, or updates that feel helpful rather than intrusive.
Nudge Feature Usage
Tooltips, badges, and progressive disclosure can gently introduce users to underutilized features that deepen engagement.
Act On User Feedback
Monitor drop-off points, support tickets, and surveys to identify what frustrates users most and fix it quickly.
Run Experiments
Test variations of messaging, workflows, or features to see what improves frequency of use. Even small tweaks can make a measurable difference.
Track and Iterate
Stickiness gains often come from compounding improvements. Keep measuring, learning, and refining to sustain progress.
Think of these as building blocks: segmentation helps you understand who you’re serving, onboarding gets them to value, personalization and nudges keep them coming back, and feedback plus experimentation ensure your product keeps evolving in step with user needs.
Implementation Considerations
Measuring stickiness may seem straightforward, but the way you implement it can make the difference between meaningful insight and misleading numbers.
A few key considerations help ensure accuracy and actionability:
Consistent Definitions
Align on what counts as a Daily Active User (DAU) and Monthly Active User (MAU) across all analytics tools.
If one platform defines “active” as any login while another requires a completed action, your ratios will be impossible to compare.
Seasonality and Campaign Effects
Expect spikes around holidays, launches, or major campaigns. Build in context when interpreting changes so you don’t mistake a temporary surge for a lasting trend.
Segment-Level Analysis
Stickiness isn’t one-size-fits-all. Break it down by cohort, persona, or acquisition channel to see which groups are forming habits, and which ones aren’t.
This can reveal whether your product resonates more strongly with certain audiences.
Complementary Metrics
Stickiness is powerful on its own, but it’s most useful when paired with retention, activation, and lifetime value (LTV).
Together, these metrics show not only how often users engage, but also whether they stick around, find value, and ultimately contribute to growth.
Handled carefully, stickiness becomes more than a single ratio. It becomes a practical lens for understanding user behavior and driving smarter decisions.
Bringing It All Together
User stickiness is more than just a ratio. It’s one of the clearest signals of engagement, product-market fit, and long-term growth potential.
By measuring how often people return, you gain insight into whether your product is truly becoming part of their daily or weekly routines.
The good news: stickiness isn’t fixed.
With consistent measurement, thoughtful experimentation, and a commitment to iteration, you can steadily strengthen the habits that keep users coming back.
At the end of the day, popularity fades, but habits endure.
The most resilient products aren’t the most popular ones. They’re the stickiest ones.


.avif)


%25201.avif)


.avif)


.svg)
