


The Super Bowl isn’t just a championship game—it’s the annual Hunger Games of advertising, where brands throw obscene amounts of money at consumer eyeballs, hoping for a few seconds of undivided attention. In this gladiator pit of marketing, the landscape of digital advertising is constantly shifting, and Northbeam has taken a deep dive into the trends shaping ad spend, auction costs, and campaign performance in the lead-up to the big game.
And because we love a good comparison, we’re putting Super Bowl advertising head-to-head with Black Friday & Cyber Monday (BFCM), the so-called "Ecommerce Super Bowl," to see how the two stack up. The insights we’ve uncovered will help brands sharpen their strategies so they can get more bang for their marketing buck—or at least avoid lighting their ad budgets on fire.
The State of Marketing Before Super Bowl 2025
All data and insights presented in this report are derived from Northbeam users and brands, providing a real-time pulse on how top advertisers approached this year's Super Bowl marketing landscape.
Before the Super Bowl weekend arrived, the digital marketing landscape was already shifting in ways that would impact advertiser strategies. TikTok, once a dominant force, faced a setback as looming ban threats led to a dip in its Super Bowl ad spend share. This opened the door for YouTube, which overtook TikTok to become the third-largest advertising platform for the event, trailing only behind Meta and Google. Meanwhile, AppLovin emerged as a surprising new contender, capturing around 3% of total ad spend—just behind YouTube (3.8%) and TikTok (3.3%).
Despite the ongoing debate and hype surrounding X (formerly Twitter), advertiser interest remained stagnant. The platform held onto a modest 0.13% share of total Super Bowl week spend, showing no notable year-over-year change.
On a broader scale, advertisers collectively increased their Super Bowl week budgets by approximately 7% compared to the previous year. Interestingly, despite the higher spend, overall efficiency remained stable, posting only a modest 0.8% improvement YoY.
The Ebb and Flow of Super Bowl Ad Spend
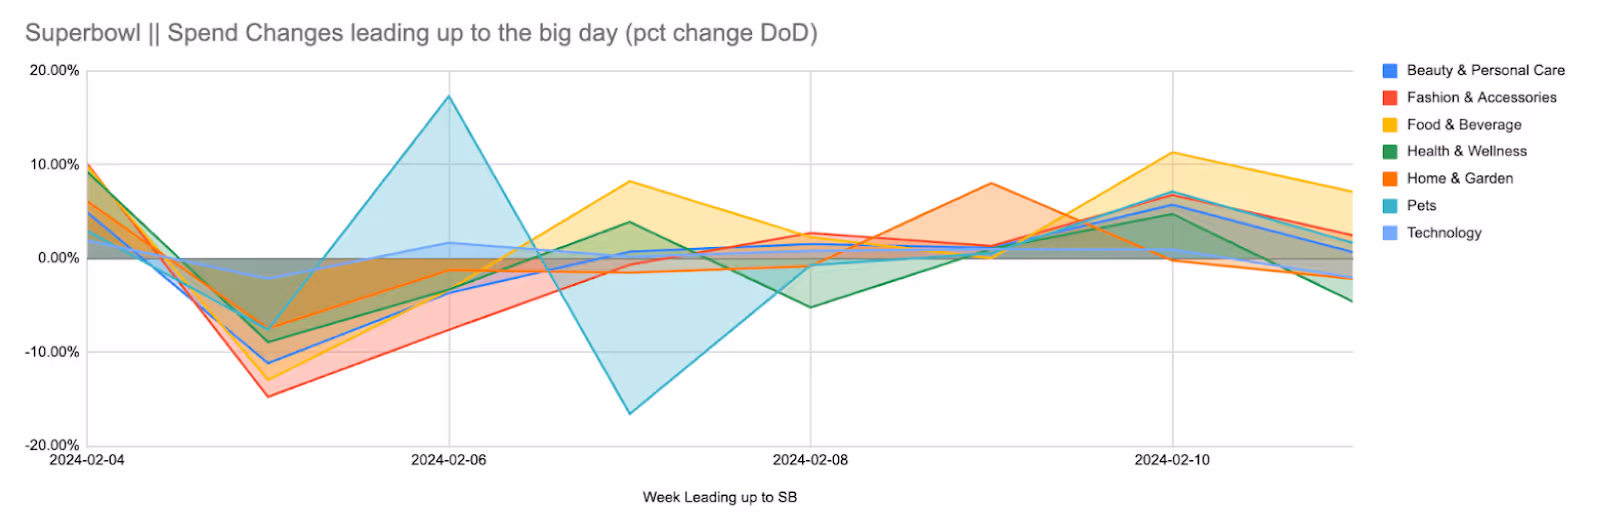
Like clockwork, Super Bowl ad costs start creeping up the Thursday before game day, peaking over the weekend before mysteriously dropping on Sunday itself. It’s as if advertisers get cold feet at the finish line, giving those who hold out an unexpected pricing advantage. For some context, here is what spend looked like across channels in 2024:
Despite the last-minute cost fluctuation, brands report that their best ad performance tends to happen in the days leading up to the game rather than on Super Bowl Sunday itself. This makes sense—by the time the game rolls around, consumers are more focused on buffalo wings and touchdown dances than clicking on ads.
Interestingly, the Food & Beverage sector leads the charge in Super Bowl ad spend, with the biggest daily jump occurring from Friday to Saturday. However, by Sunday, the increase slows down—perhaps because everyone is already fully stocked with chips and beer, and no amount of last-minute marketing is going to change that.
Traditional media is still kicking, though digital dominates. In 2024, TV placements accounted for almost 5% of the total media mix, while Connected TV (CTV) placements barely scratched 0.5%. Despite the ongoing digital revolution, traditional TV remains a go-to for brands looking for that "big moment"—even if most viewers are on their phones tweeting about the commercials instead of actually watching them.
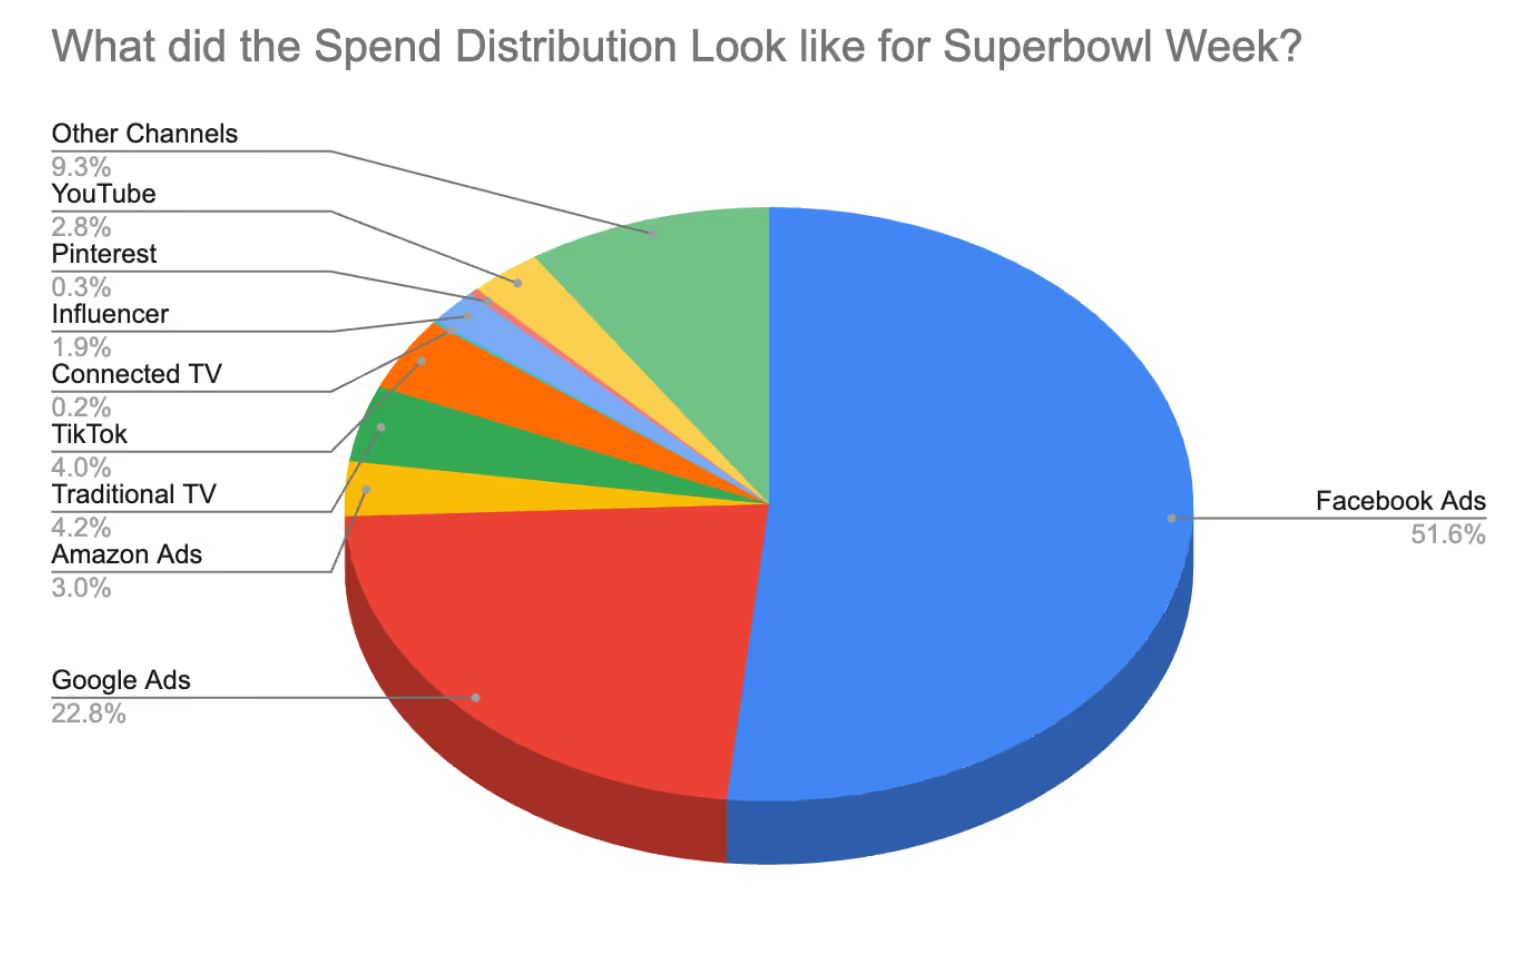
How Brands Allocated Their Budgets Across Platforms
When it comes to ad spend distribution, Facebook and Google are still the cool kids at the lunch table, eating up over 74% of total spend. Meanwhile, traditional TV, hanging on by a thread, makes up just over 4%, proving that while old habits die hard, they do eventually fade.
Influencer marketing is gaining traction, but it’s still playing in the kiddie pool with under 2% of total ad spend. However, the data shows a small but notable increase in influencer marketing investments as game day approaches, suggesting that brands are warming up to the idea of leveraging social media stars for last-minute hype.
The Cost of Visibility: Auction Price Trends
The closer we get to Super Bowl Sunday, the more advertisers have to pay for the privilege of appearing in front of consumers who are already drowning in ads. Most platforms see a predictable surge in CPMs leading up to the weekend, but here’s the twist: YouTube and Snapchat actually experience slight declines in auction costs over the weekend.
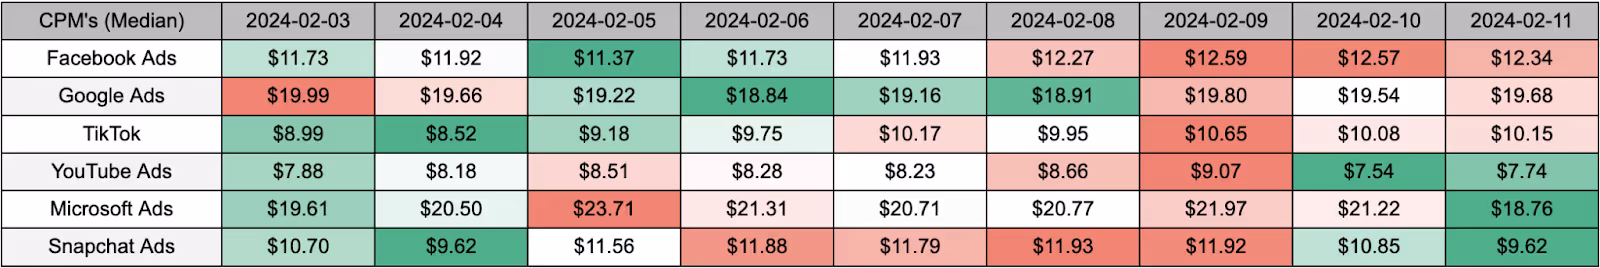
Why? Likely because more inventory becomes available, meaning brands willing to pivot to these platforms could snatch up some last-minute deals while their competitors shell out premium rates elsewhere. Meanwhile, Google and Facebook remain the Fort Knox of digital advertising—consistently expensive, but still where most brands are putting their money.
Super Bowl vs. BFCM: Which Offers Better Returns?
If Super Bowl advertising is the high-stakes poker game of marketing, BFCM is the full-blown shopping apocalypse. BFCM’s spending behavior is defined by an all-out buying frenzy, with ad efficiency peaking as eager consumers throw money at their screens. In contrast, Super Bowl advertising is more of a slow burn, with spending and efficiency spread out more evenly over the week.
Check out the tail on this chart for BFCM 2024:
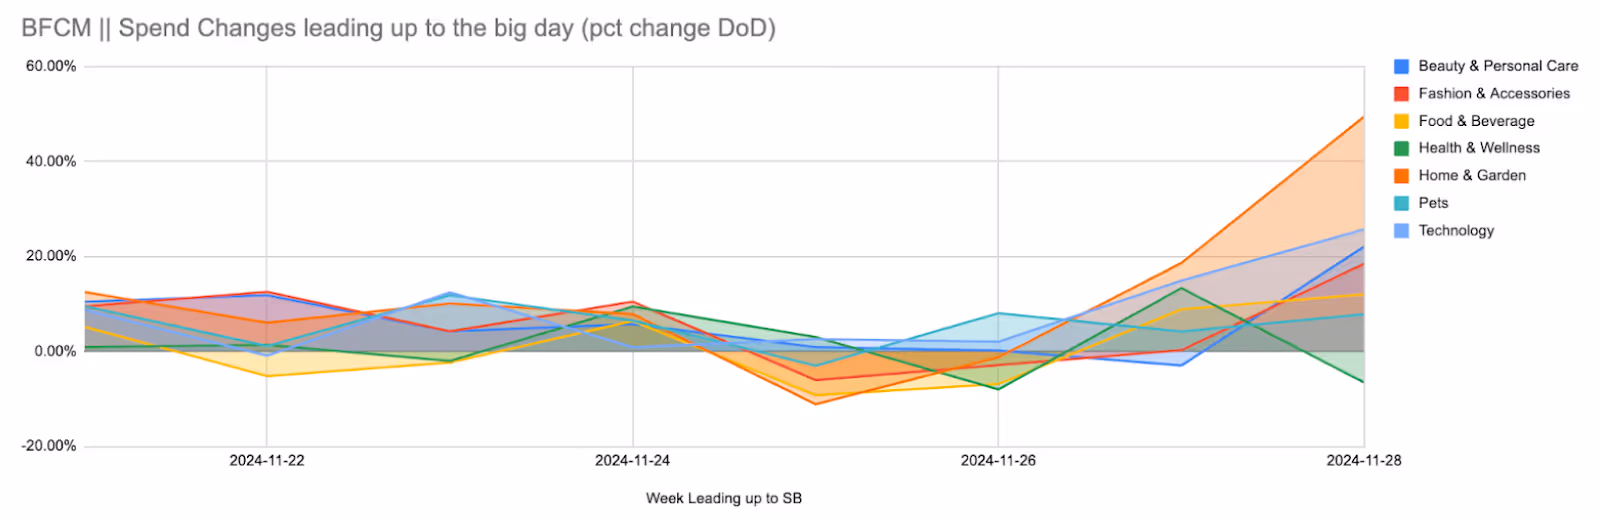
Most brands see their biggest spend jump between Friday and Saturday of Super Bowl week, whereas BFCM experiences a steady, methodical build-up. Efficiency is also a key differentiator—BFCM’s shopping-driven engagement results in immediate ROI, whereas Super Bowl ad impact tends to be more drawn out, potentially influencing consumer behavior over a longer period.
How to Measure the Impact of Super Bowl Ads
What Should We Be Benchmarking?
Measuring the success of a Super Bowl ad campaign isn’t as simple as checking a few vanity metrics. Brands should take a two-pronged approach: comparing Period over Period (to assess performance changes leading up to and during Super Bowl week) and Year over Year (YoY) (to determine long-term trends and growth compared to previous Super Bowls).
Understanding Super Bowl Week Success
At the end of the day, business success is the ultimate metric. Revenue, traffic, and on-site efficiency will provide the clearest picture of whether the Super Bowl ad spend actually moved the needle. However, peeling back the layers reveals deeper insights:
Marketing Efficiency
- Return on Ad Spend (ROAS): Both blended and first-time customer-specific ROAS should be analyzed to determine the financial return on Super Bowl campaigns.
- Cost to Acquire a Customer (CPA / CAC): A major benchmark in determining efficiency shifts due to Super Bowl-specific messaging and offers.
- Conversion Rate (ECR) & Revenue per Visit: These metrics show if users are just browsing or if they are actually making purchases.
Creative Performance & Engagement
Not all ads are created equal—some flop, some go viral, and others just generate steady engagement. Evaluating creative success means looking at:
- Cost per Click (CPC) & Cost per Mille (CPM): Are we paying more per click/impression compared to pre-Super Bowl periods?
- Cost per New Visit (CPNV) & New Visit %: Did the campaign bring in new customers or just re-engage the usual audience?
- Click-Through Rate (CTR) & Cost per Engagement: A strong creative piece will increase these numbers, proving the messaging resonated with consumers.
The Invisible Lift: Organic & Direct Traffic Impact
Super Bowl ads—especially on traditional formats like TV and out-of-home—aren’t always trackable through direct clicks. But that doesn’t mean they don’t work. Brands should analyze:
- Direct Traffic & Organic Search Traffic: Did the Super Bowl campaign boost unprompted brand searches and direct visits?
- Organic Social Traffic: If users discuss, share, or tag the brand after seeing the ad, that’s a win—even if it’s not directly attributable.
- New Customer %: What portion of total sales came from first-time buyers influenced by Super Bowl exposure?
Multi-Touch Attribution: The Full Customer Journey
Looking at only first-click or last-click data gives an incomplete picture. A combination of First-Touch (to assess new journey starts) and Multi-Touch Attribution (to understand how ads assisted conversion) provides a more accurate measurement of true campaign impact.
Measuring Brand Search Lift & Omni-Channel Impact
When Super Bowl campaigns succeed, consumers tend to Google the brand name more. Tracking changes in:
- Total Search Impression Volume (paid and organic)
- Paid Brand Search Impression Share
Additionally, Super Bowl ads can have a halo effect across other sales channels, including Amazon and third-party marketplaces. Brands should analyze whether there’s a correlation between increased spend on direct channels and spikes in these external platforms.
The Long Tail Effect: Tracking Performance Beyond the Super Bowl
Finally, brands shouldn’t expect their Super Bowl efforts to disappear once Monday rolls around. Depending on the business model, the impact of Super Bowl marketing can extend for weeks or even months. Monitoring efficiency beyond the immediate timeframe will ensure brands truly understand the long-term value of their investment.
Lessons for Brands: How to Maximize Super Bowl Advertising Impact
So, what’s the playbook for brands looking to maximize their Super Bowl ad dollars? First, don’t just blindly dump your entire budget into game-day ads. The data shows that efficiency often peaks before the Super Bowl itself, meaning early spend could yield better results. If you must advertise over the weekend, platforms like YouTube and Snapchat may offer an unexpected cost advantage.
Secondly, while traditional TV still has its place, it’s no longer the undisputed king of Super Bowl advertising. With Connected TV gaining traction, brands should be thinking about how to leverage emerging digital formats rather than relying on the same old playbook.
Finally, remember that Super Bowl advertising is a marathon, not a sprint. Instead of going all-in for one day of expensive exposure, consider how your campaign can build anticipation before the game and keep momentum going afterward. At the end of the day, a well-planned strategy will always outperform a last-minute Hail Mary.
Super Bowl advertising might be a high-stakes game, but with the right data-driven approach, brands can ensure they’re making smart plays that lead to real results—no halftime show required.


.avif)


%25201.avif)


.avif)


.svg)
