


.avif)
Black Friday 2023 has come and gone. So how did it go, and how does your brand stack up?
Depends on who you ask.
Shopify self-reported that merchants drove a record high $9.3 billion in Black Friday Cyber Monday sales, a 24% increase year over year.
This number isn’t adjusted to account for all the new merchants Shopify has onboarded this year, so that volume increase could be driven by brands new to the platform. Therefore this isn’t the most useful benchmark.
Salesforce reports 5% online sales growth year over year across the BFCM season, with Friday and Saturday as the strongest days. Cyber Monday was the weakest day, with only 3% year over year growth. (Is Cyber Monday dead? I asked my mom if she did any Cyber Monday shopping, and she complained that I don’t call her enough. So the verdict is still out, but performance this year doesn’t look great.)
MasterCard’s Spendingpulse gave an assessment that most experts seem to agree with: ecommerce sales on Black Friday increased 8.5% year over year, while in-store sales only increased 1.1%.
The experts are suggesting most brands would see between a 1% and 8.5% year over year increase in revenue. But is it that simple? Let's look at the numbers from the "Cyber 5", the five days from thanksgiving to Cyber Monday.
“Cyber 5” Growth Benchmarks
.avif)
We looked at petabytes of ecommerce data and calculated percentile ranks of company performance based on year over year changes in revenue and first-time transactions (one of our favorite acquisition measures.) If your brand saw greater than a 3.7% increase in revenue and a 1.8% increase in first-time transactions across the Cyber 5, congratulations - you are at least in the 50th percentile of ecommerce businesses.
So, by these measures, if you did better than 5% increases in revenue year over year, you beat the worldwide average.
Don’t listen to “build in public” schmucks on X - use this chart to evaluate how you actually did this year, compared to everybody else.
Black Friday Cyber Monday Performance Benchmarks
Here’s charts showing ad performance metrics, comparing this year’s Cyber 5 versus last year’s.
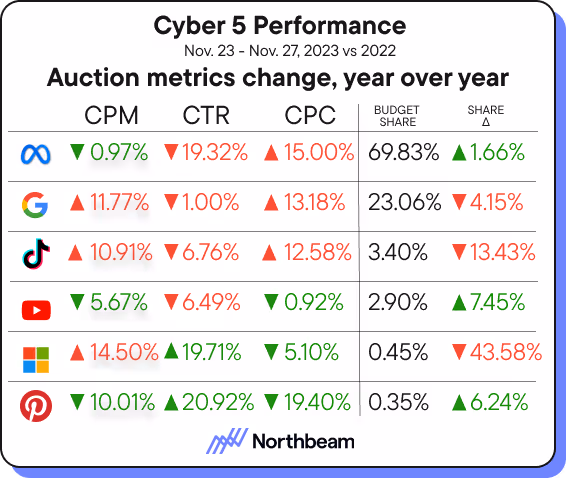
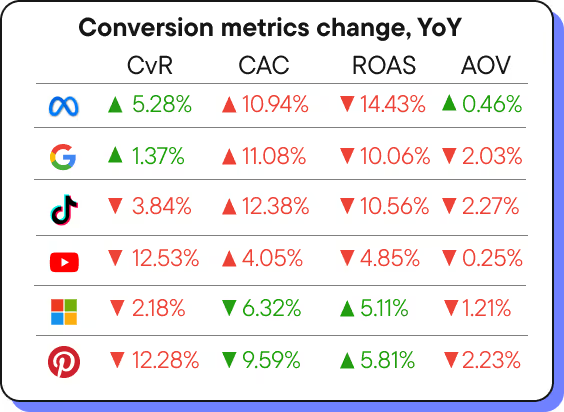
Notable changes:
Facebook’s increasing share of budget is having brutal effects on clickthrough rate, cost per click, return on ad spend and customer acquisition costs. Performance marketers trust Facebook for conversions. Under intense pressure in a low-consumer-confidence environment, it’s no surprise budgets are consolidating to a trusted source of conversions.
What is surprising is the stunning almost 20% drop in clickthroughs. Although conversions technically increased, double-digit increases in CAC and double-digit reductions in ROAS probably nullify any conversion gains we saw on Facebook this year. No wonder TikTok is fighting for improved conversion tracking - we’re reaching critical Facebook mass.
TikTok budgets pulled back by 13% year over year. Although this is still one of our favorite growth platforms, the metrics don’t look good. 10% CPM increases, 12% CPCs, -12% conversion rate.
While this looks bad, I place blame on the advertisers themselves. Many still have no damn clue how to make a good TikTok ad, and these people are pulling down the averages with mountains of wasted spend.
Return on ad spend is down everywhere. This is just how it is. These ad platforms demand increasing profits from their advertising businesses. The profit motive drives these platforms to continually push up the prices of their placements. We will never see cheaper advertising than what we are experiencing at this moment. These data support that efficiency in your ad spend, via smart attribution and omnichannel experimentation, is the only way to win.
Industry performance during the Cyber 5.
Now the good stuff. Here’s two charts showing year over year changes, day by day, during the Cyber 5, broken down by industry, featuring blended revenue and first time transactions. Read ‘em and weep.
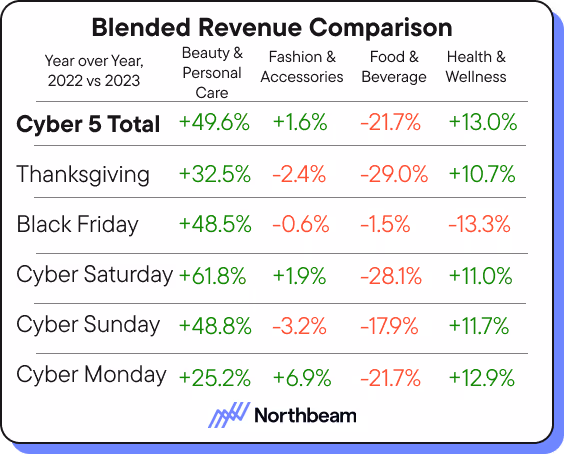
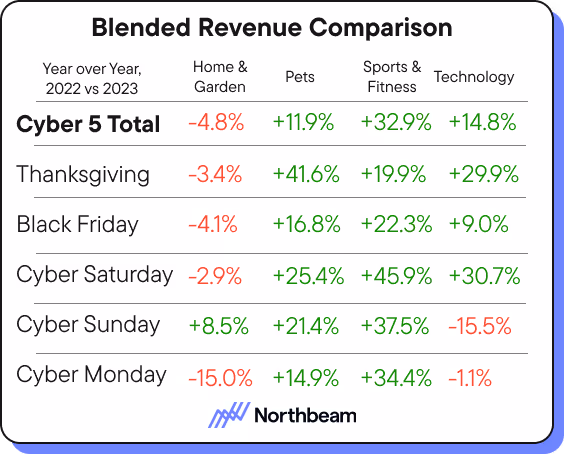
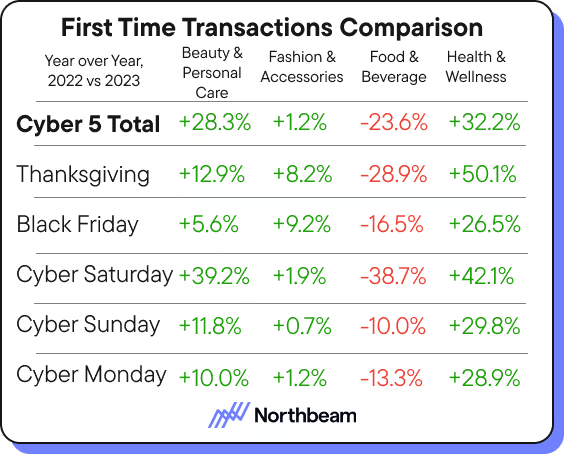
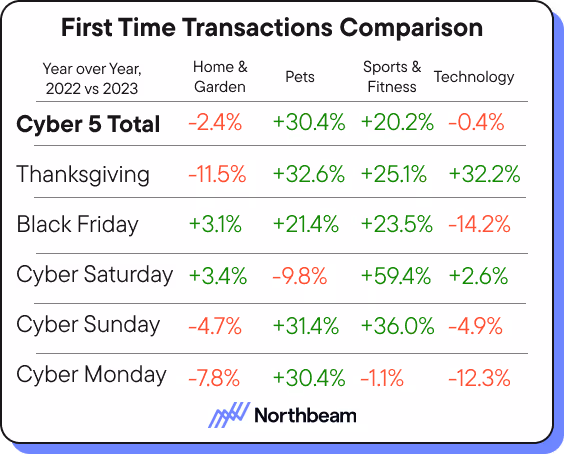
Some highlights:
Home & Garden took a dump. What happened you guys? I have a guess: growth of U.S. home ownership is tanking. No need to buy gardening gloves when you live on a seventh-floor walkup.
Beauty & Personal Care is slaying. These are typically the smartest Cyber 5 brands in the game. I bet Jones Road Beauty outperformed this by a significant amount. By these measures, most beauty brands using Northbeam likely ended up in the 75th percentile and above for growth.
It’s a good year for self improvement. Interestingly, both Health & Wellness and Sporting Goods & Fitness industries saw better first time transaction increases than they did blended revenue growth year over year. Is this driven by reduced prices? Lower AOV products? The new year will tell.
What about our white paper predictions on the Cyber 5?
Call it precognition, foresight, straight-up magic: were our assessments in the Q4 White Paper about this holiday season accurate?
Prediction: regardless of economic indicators, consumers are anxious about money and are likely to spend less than usual.
Result: false. Sure, we did spend more as a nation, but there’s some sketchy indicators. “Buy now, pay later” is up 47% year over year, and Cyber Monday is apparently irrelevant. We’re comfortable saying this weren’t as good as they could be.
Prediction: This will be the most fiscally expensive, creatively challenging, and competitively crowded performance advertising market we’ve ever seen.
Result: 100% true. Just look at those metrics above. Ads are more expensive or less efficient by double digits on like every channel.
Prediction: Cyber 5 sales will kick off the first week in November but consumer behavior won’t spike until around the 20th of November.
Result: true. I’ll do you one better: the data suggests that conversion rates spike on both Fridays in November prior to the holiday. Both 2022 and 2023 charts show as much. Plus, the upwards growth in conversion rate - our proxy for consumer buying interest - began to rise at the same pace after the 6th of November. This gives some weight to the “run sales early” argument, but the volume still pales in comparison to Black Friday itself.
Verdict: we were pretty damn close on most of our assessments. Next time we’ll be even more niche and focused in our predictions. I’m feeling lucky.
The Breakdown:
Here’s what you should know:
Year over year growth was not equal across all industries. The widely shared “8.5%” year over year growth number you see reported everywhere is an aggregate of many industries. Our reporting shows that growth is uneven - don’t measure your performance against numbers that aren’t relevant to your industry.
You should be studying what beauty and personal care brands did on Black Friday to attract repeat purchasers. Look at the year over year revenue growth numbers in the charts above, they’re killing it. These strategies often include smart early emailing campaigns and gift with purchase. Bonus data: Beauty and Personal Care saw their year over year blended revenue increase 39.7% in October. They’re doing something right.
Cyber Monday is losing power, so stop planning around it. Even looking at brands who did well during the Cyber 5, several of them saw their lowest year over year growth on Monday. As ALL shopping begins to pivot online, a day dedicated to it seems redundant. Also, it’s easier to apply discount codes and specific offers to online orders.
Thanksgiving is a decent day for sales, actually. We’re always so focused on Friday, but in several industries, Thanksgiving was the best day for sales. Maybe all your customers weren’t in food comas after all. Make Thanksgiving a part of your Cyber 5 media buy.
Black Friday shopping sucks and people care less about it - can you create excitement again. When was the last time you were legitimately excited to do holiday shopping? Long gone are the fistfights over Furbies we used to see in the early aughts. But are we right to point the finger at consumers? Black Friday discounts used to be steep enough to inspire violence. These days marketers are expecting 200% year over year gains on a 15% discount offered on a product bundle that’s pointless for customers but convenient for the 3PL. We’ve lost our Christmas spirit.
Next year’s Cyber 5 will be even worse. We’ll be in the immediate aftermath of the most consequential American election of a generation and the stifling ad spending that comes with it. Consumer confidence is set to drop, not improve. Not to mention CPMs continue to rise in price. There’s no relief coming, so don’t plan for it. Plan instead to be smart and efficient now.
Final comments
This isn’t the Cyber 5 we deserved, but it’s the one we got. Performance was divided across industry and creative lines. Brands who use proper attribution outperformed everybody else. Creative remains king - the brands with quality, authentic ads won while the “60% off!!!” screamers yelled into a void. This Cyber 5 defined what our algorithm-driven future will look like, so we hope you were paying attention.


.avif)


.avif)


.svg)
