


Today’s customer journeys are anything but straightforward.
A shopper might discover your brand on TikTok, research on Google, compare on desktop, and finally purchase through an email offer on their phone, all within a single week.
With so many channels, devices, and touchpoints in play, it’s no wonder marketers struggle to connect the dots.
That’s where customer journey mapping comes in.
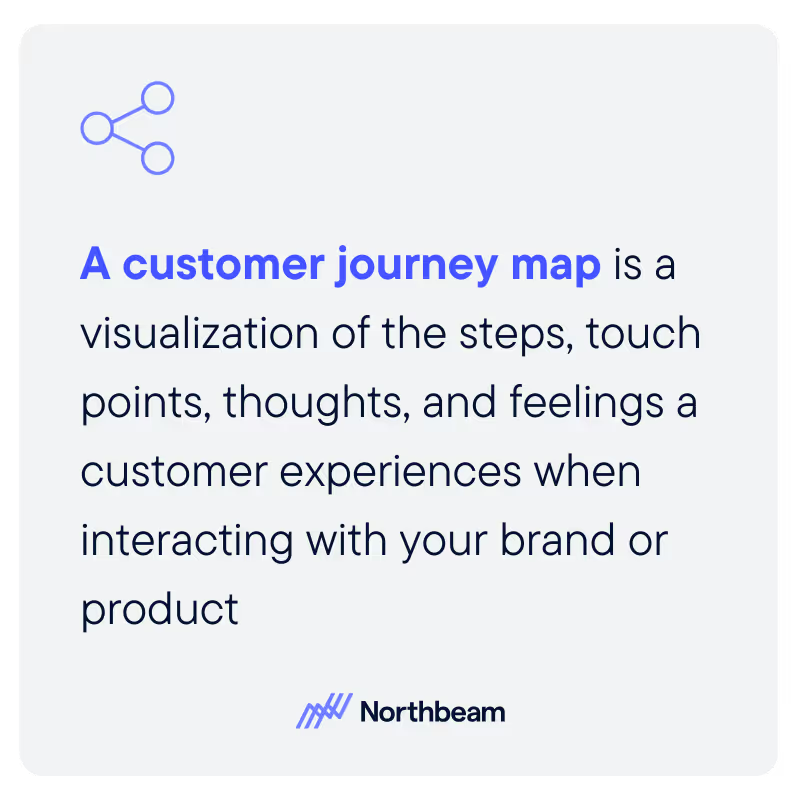
What is customer journey mapping? At its core, it is the practice of visualizing and analyzing how customers move through the stages of awareness, consideration, purchase, and beyond.
Done well, it transforms scattered interactions into a clear, data-driven picture that helps marketers improve ROI and customer experience at the same time.
In this guide, we’ll cover:
- What customer journey mapping is and why it matters
- The core components every map should include
- Practical examples of how marketers use journey maps
- A step-by-step process for building your own
- Common pitfalls and how to avoid them
- Tactics to optimize your map over time
In this guide to journey mapping for marketers, you’ll learn how to turn messy, multi-channel customer paths into an actionable framework that aligns teams, reduces friction, and drives growth.
Definition & Why It Matters
Customer journey mapping is a visual, data-informed representation of how a customer persona moves through the stages and touchpoints needed to achieve a goal.
That goal could be making a purchase, subscribing to a service, becoming a loyal advocate, or something else relevant to your business.
Instead of thinking about marketing as a set of disconnected campaigns, journey mapping gives you a holistic picture of how real people experience your brand.
Why does this matter? Because journeys are rarely linear. Customers bounce between channels, devices, and content types before making a decision.
A good journey map helps you:
- Reveal friction points and “moments that matter.” Pinpoint where customers drop off, hesitate, or need more reassurance.
- Align teams across functions. Marketing, product, sales, and customer support all get on the same page about what customers actually experience.
- Inform smarter content and media strategies. Match the right message and channel to the right stage of the journey.
- Boost conversion and retention. By removing friction and doubling down on high-impact moments, you naturally increase ROI, customer lifetime value (CLV), and long-term loyalty.
There’s also a direct financial benefit: journey maps guide budgeting and prioritization.
Instead of spreading spend evenly or chasing the loudest channel, you can see exactly which stages and touchpoints drive the most value, and which ones aren’t worth continued investment.
How Customer Journey Mapping is Used
Customer journey maps aren’t just pretty visuals, they’re practical tools that marketers can use to make smarter, more targeted decisions every day.
When you can see the journey laid out, it becomes much easier to match the right message, offer, or channel to the exact stage a customer is in.
Here are a few of the most common applications:
Campaign Sequencing
Use the customer journey map to align messaging with stage-specific needs.
For example, focus on credibility and education during awareness, then shift to urgency or differentiation during consideration and purchase.
Conversion Rate Optimization (CRO) Roadmap
Identify the high-friction steps that cause the biggest drop-offs.
By prioritizing tests where customers get stuck, you maximize the return on optimization efforts.
Lifecycle Marketing
Design onboarding, activation, retention, and win-back campaigns that address the full customer lifecycle, not just acquisition.
Channel Orchestration
Assign the right channels to each stage.
Paid social might be ideal for early awareness, while email, SMS, or loyalty programs are better suited for retention and advocacy.
To make this more concrete, here are two quick examples:
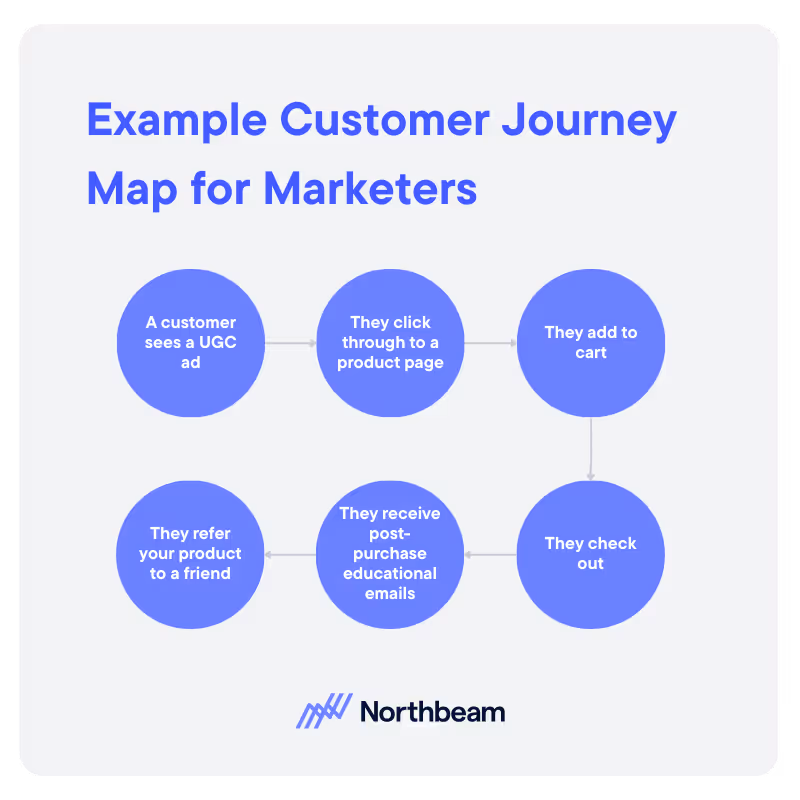
- eCommerce brand:
- A customer might see a UGC ad
- Click through to the product detail page (PDP)
- Add to cart
- Checkout
- Receive post-purchase education emails
- Eventually leave a review or referral
- Subscription service:
- A prospect discovers the brand via an influencer
- Signs up for a free trial
- Receives a guided onboarding sequence
- Hits a paywall
- Receives churn-prevention messaging
- Later reactivates after canceling
In both cases, journey maps make it clear where marketers should invest resources, what messages will resonate, and how to keep customers moving forward.
Core Components of an Effective Customer Journey Map
A strong customer journey map balances structure with insight. Here are the core components to include in your customer journey map:
- Personal and goal: Start by defining who you’re mapping and what success looks like. Is it a first-time shopper making a purchase? A subscriber activating their account? A repeat customer advocating for your brand? Narrowing the scope ensures the map stays actionable.
- Stages: Break the journey into key phases: awareness, consideration, purchase, onboarding, and retention/advocacy. These stages give your map structure and help everyone speak the same language when discussing customer behavior.
- Touchpoints and channels: List all the interactions across owned (website, app, email), paid (ads, sponsorships), and earned (reviews, referrals) channels. Don’t forget offline moments if they matter to your brand.
- Customer lens: Capture the human side of the journey: the jobs-to-be-done, common questions, emotions, objections, and triggers at each stage. This context is often what separates a useful map from a surface-level one.
- Friction and opportunities: Identify where customers drop off, get stuck, or lose interest. Just as importantly, highlight the opportunities where the right content or offer could move them forward more smoothly.
- Ownership and KPIs: Assign responsibility for each stage or touchpoint. Who’s accountable for improving product page-to-cart conversion? Who owns retention emails? Tie each area to measurable KPIs so insights translate into action.
Together, these components transform a journey map from a static diagram into a living playbook for growth and CX.
How to Create a Customer Journey Map
A customer journey map is only as good as the process behind it.
The goal isn’t to produce a beautiful diagram: it’s to build a tool that reflects real customer behavior and sparks action across your team.
Here’s how to map the customer journey:
1. Define Scope, Persona, and Success Metrics
Start small. Pick one persona and one primary journey (for example: a first-time customer completing their first purchase).
Decide what success looks like (conversion, activation, or repeat engagement) so the map has a clear focus.
2. Gather Data from Multiple Sources
Start quantitative: Web and app analytics, attribution data, funnel conversion rates, time between steps, support tags.
Then move on to the qualitative: Surveys, interviews, session replays, customer support tickets, sales notes, or on-site polls.
Combining hard numbers with customer voice ensures your map captures both what’s happening and why.
3. List Stages and Touchpoints
Break the journey into its phases (awareness, consideration, purchase, onboarding, retention/advocacy) and add the touchpoints within each.
Don’t forget micro-conversions like viewing a product detail page, adding to cart, or opening an email.
4. Add Customer Context
For every stage, note the customer’s motivations, anxieties, and questions.
Highlight the “moments that matter” where reassurance, education, or incentives can make the difference between drop-off and progress.
5. Document Friction and Hypotheses
Call out where customers abandon the journey or get stuck.
Then propose testable ideas for fixing the problem; for instance, simplifying checkout steps or adding social proof to product pages.
6. Assign Owners and KPIs
Make sure every stage has a clear owner and measurable metric. This ensures insights don’t die on the page.
7. Validate with Stakeholders
Share the draft map with marketing, product, customer support, and even sales or finance.
Cross-functional input strengthens the map and helps with buy-in when it’s time to act.
8. Implement and Iterate
Treat the map as a living document.
Run experiments to address friction, track results, and update the map quarterly as your product and market evolve.
Common Mistakes and Misconceptions
Customer journey mapping for marketers is powerful, but only if it’s done right.
Many teams fall into the same traps, which can leave them with a pretty diagram that gathers dust instead of driving results.
Here are the most common mistakes to avoid:
Lack of Data
Building a map based on hunches or assumptions is a recipe for misalignment.
Real insights come from pairing analytics with the customer’s own voice through surveys, interviews, and support feedback.
Over-Complexity
If your map has so many touchpoints, arrows, and annotations that no one can read it, it won’t get used. Keep it focused and simple enough to be actionable.
Clicks-Only
A journey isn’t just a series of digital interactions.
Ignoring customer emotions, objections, or even offline moments leaves huge blind spots.
Static Artifact
A map that never gets updated quickly becomes irrelevant.
Journeys evolve as your product, channels, and customer behaviors change. Your map should too.
No Ownership or KPIs
Without assigning responsibility and measurable goals, the insights stay theoretical.
Every stage should have a clear owner and metric to track progress.
The takeaway: a good journey map is grounded in data, human-centered, simple to use, and always evolving.
How to Improve or Optimize Your Customer Journey Map
The best way to strengthen your journey map is to tackle the common pitfalls head-on.
Here’s how to turn each mistake into an opportunity for improvement:
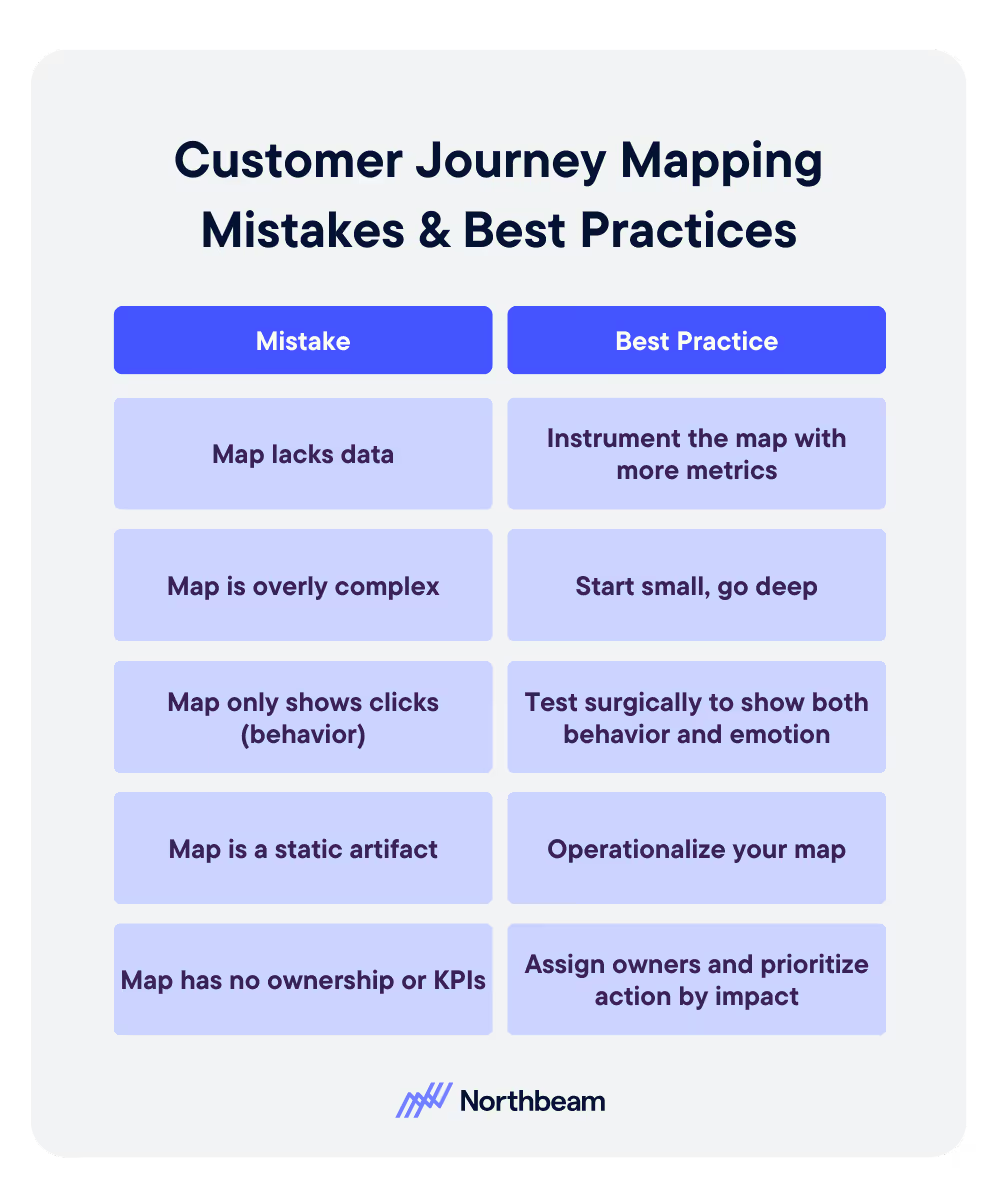
Instrument the Map
Instead of guessing, ground your map in reality.
Overlay metrics like conversion rates between stages, average time to progress, drop-off hotspots, and lifetime value (LTV) by path.
This makes your map a data-powered decision tool.
Start Small, Go Deep
Avoid overwhelming the team with an unreadable tangle of touchpoints.
Begin with one persona and one primary journey. Once you’ve proven value, like boosting first-time purchases or cutting churn, expand gradually.
Test Surgically, Beyond Clicks
Journeys aren’t just a series of clicks.
Use experiments and A/B tests to address customer motivations, anxieties, and objections at key stages.
Feed the results back into the map so it reflects both behavior and emotion.
Operationalize Your Map
A map that never changes is quickly outdated.
Build a cadence to review metrics and refresh the map quarterly, and tie updates directly into your marketing or product roadmap so it stays active and relevant.
Prioritize Actions by Impact
Assign clear owners and focus first on the friction points with the biggest revenue stakes.
When responsibility and KPIs are in place, insights move from theory to measurable progress.
And underpinning all of this is reliable data.
Tools like Northbeam provide cross-channel attribution and performance insights, helping you validate paths, quantify stage impact, and track improvements over time.
From Map to Momentum
Customer journey mapping takes what often feels like a fuzzy, unpredictable experience and turns it into a clear, prioritized plan for growth.
By visualizing the stages customers move through, and layering in real data, ownership, and KPIs, marketers can move beyond guesswork to make decisions that improve both ROI and customer experience.
The best advice is to start small: build an initial map for one persona, validate it with data, and refine it through iteration.
From there, you can expand to more journeys and continue optimizing, using the map as a living tool that guides strategy across teams.


.avif)


%25201.avif)


.avif)


.svg)
