


When people talk about product growth, Monthly Active Users (MAU) is one of the first metrics that comes to mind.
It tells you how many unique users actively engage with your product in a given month, offering a snapshot of your audience’s true engagement and loyalty.
MAU reflects sustained, recurring use that signals product-market fit and long-term health. Tracking it consistently helps you understand not just how many people are discovering your product, but how many are coming back for more.
In this article, we’ll break down exactly what MAU means, how to define and measure it accurately, and how to interpret changes in your monthly active user trends.
You’ll learn how MAU compares to other engagement metrics like DAU and WAU, what to watch for in your data, and how to use these insights to guide product, marketing, and growth decisions.
Defining MAU: What It Means & Why It Matters
Monthly Active Users (MAU) is one of the most common metrics used to understand how many people actually use your product within a given 30-day period.
In simple terms, MAU counts the number of unique users who engage with your product at least once in a rolling month.
This engagement could mean anything from logging in, completing a key action, or using a specific feature depending on how your business defines “active.”
That last point is crucial: what qualifies as “active” isn’t universal.
For a social media platform, it might be posting, liking, or messaging. For a SaaS product, it could be running a report or completing a workflow.
Defining activity too broadly (like any login) can inflate your numbers, while defining it too narrowly can hide genuine engagement.
The key is to choose a definition that reflects meaningful interaction, the kind of behavior that signals users are actually getting value.
Investors and product teams alike use MAU as a shorthand for overall product health: rising MAU suggests growing adoption and retention, while declines can signal churn, friction, or competition pulling users away.
In practice, MAU serves as a core growth signal across teams:
- Product uses it to measure adoption and validate feature success.
- Marketing tracks it as a response to campaigns or seasonality.
- Investors see it as a proxy for momentum and market traction.
In short, MAU gives you a pulse on whether your product is not only attracting users, but keeping them.
MAU vs DAU vs WAU: Other Activity Metrics
While MAU captures how many people engage with your product in a month, it’s just one piece of the activity puzzle.
Most companies also look at DAU (Daily Active Users) and WAU (Weekly Active Users) to understand how frequently people return.
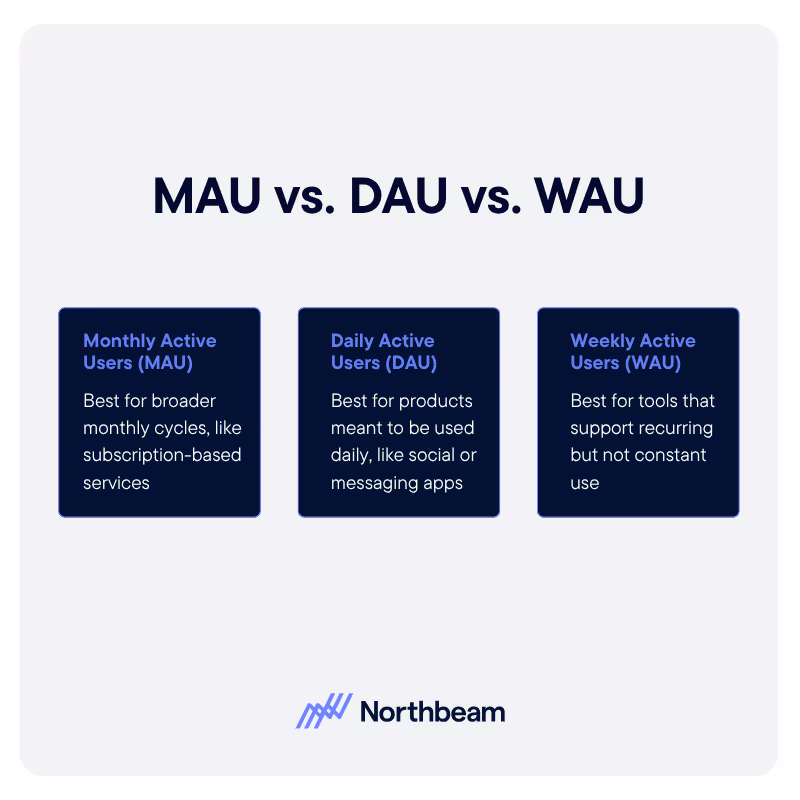
- DAU measures the number of unique users active on a given day; a great pulse check for products meant to be used daily, like messaging apps or social platforms.
- WAU looks at weekly engagement; often the sweet spot for tools that support recurring but not constant use, such as project management or eCommerce dashboards.
- MAU, meanwhile, shines when your product fits into users’ broader monthly cycles; for example, subscription-based services, billing tools, or long-term planning apps.
Together, these metrics help paint a fuller picture of user behavior.
DAU vs. MAU Importance
One of the most useful ways to connect them is the DAU/MAU ratio, sometimes called a stickiness metric. It shows what percentage of your monthly users return on a typical day.
A higher ratio means users find ongoing value and are integrating your product into their regular routines. For example, a ratio above 20% often indicates strong engagement for a consumer product, while enterprise tools may trend lower due to less frequent usage patterns.
Knowing when to focus on DAU vs. MAU depends on the nature of your product:
- Daily tools (e.g., chat apps, task trackers) should prioritize DAU: consistency and habit formation matter most.
- Periodic tools (e.g., accounting software, marketplaces) should emphasize MAU: breadth of retention over time is the key metric.
MAU Limitations
Of course, MAU alone can never tell the whole story. It can’t show depth of engagement (how long or meaningfully users interact) or the quality of those sessions.
Different teams might also define “active” differently, leading to data inconsistencies.
That’s why MAU should always be paired with complementary indicators, such as session duration, churn rate, or feature-specific usage, to create a more accurate view of true user engagement metrics.
How to Measure & Define MAU Accurately
Tracking MAU for growth seems simple on the surface, but accuracy depends on how you define and measure it. Subtle differences in setup can lead to big variations in your reported numbers, so a consistent, transparent methodology is key.
1. Choose Your “Active” MAU Definition
Start by identifying the action that represents meaningful engagement.
For some products, that might be any session or login; for others, it’s a specific key behavior like sending a message, creating a project, or making a purchase.
The goal is to capture real value moments, not vanity metrics.
2. Ensure User Identification and Deduplication
To avoid inflated numbers, you need a reliable way to identify unique users. Most teams do this through a user ID system, device ID, or cookies that tie activity back to one person or account.
Deduplication is critical: one user logging in on multiple devices shouldn’t count multiple times.
3. Use a Rolling 30-Day Window (Not Just Calendar Months)
Many analytics tools default to monthly reporting, but a rolling 30-day window provides a truer picture of ongoing activity.
Instead of resetting at the start of each month, it continuously measures the last 30 days, giving you smoother, more actionable trend lines and avoiding arbitrary cutoffs.
4. Handle Edge Cases
Inactive accounts, bots, and duplicates can all skew your MAU data.
- Exclude accounts that haven’t verified or completed onboarding.
- Filter out automated or spam activity.
- Set a threshold for reactivation (e.g., users inactive for 90+ days are removed until they return).
These small steps make a big difference in maintaining data integrity.
5. Pick the Right Tools for MAU Tracking
You can measure MAU through a range of analytics platforms, depending on your setup:
- Google Analytics 4 (GA4) or Mixpanel for web and app analytics.
- Product analytics suites for deeper event-based tracking.
- Custom data systems if you need more control or privacy compliance.
6. Maintain Data Quality and Consistency
Your MAU metric is only as reliable as the data you feed it.
Make sure your event logging, attribution, and cleaning practices are standardized across teams. Document how “active” is defined, when data is refreshed, and what’s excluded so everyone interprets the number the same way.
When measured accurately, MAU becomes a powerful, trustworthy signal that you can safely use to track growth, retention, and engagement trends without worrying about false positives or noise.
Interpreting MAU Trends & Signals
Once you’ve defined and tracked MAU consistently, the next question is: what are the numbers actually telling you?
MAU trends offer valuable clues about product health, user behavior, and the effectiveness of your growth strategies, but only if you know how to read them.
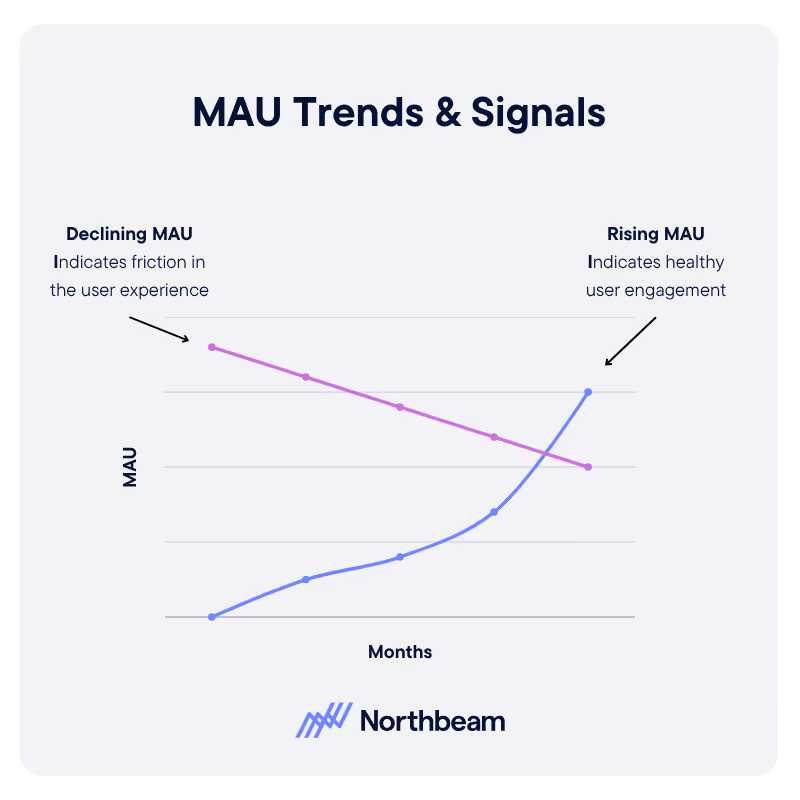
Rising MAU: Growth, Adoption, and Retention
A steady or sharp increase in MAU usually signals healthy user acquisition and engagement. It can mean that new users are finding value quickly, existing users are sticking around, or both.
You’ll often see MAU spikes after successful product launches, marketing campaigns, or PR moments, followed by a stabilization period. If those new users keep showing up in the following months, it’s a sign your retention loop is working.
Plateauing or Declining MAU: A Warning Sign
When MAU growth slows or reverses, it can indicate churn, disengagement, or friction in the user experience.
Common causes include:
- A confusing onboarding flow or recent UI change
- Technical issues or poor performance
- Competitors capturing attention
- Lack of fresh content or features
A short-term dip isn’t always cause for alarm, it could reflect seasonality or campaign cycles, but persistent decline deserves investigation. Pair MAU with churn, NPS, or usage depth metrics to pinpoint the issue.
Understanding Seasonal or Cyclical Effects
Certain products have natural rhythms. For instance, budgeting apps spike in January, travel platforms surge in summer, and education tools peak during the school year.
Recognizing these patterns helps you avoid misreading normal fluctuations as problems. Track year-over-year MAU to distinguish true shifts in engagement from seasonal cycles.
Using Cohort Analysis for Deeper Insight
MAU alone gives a top-line view, but breaking it down through cohort analysis can help reveal why it’s changing.
Segment your users by acquisition channel, geography, signup month, or product version to see which groups are growing, retaining, or dropping off.
For example, you might find that users acquired through organic search retain better than those from paid ads, or that engagement is strong in Europe but lagging in North America.
Correlating MAU with Product and Marketing Actions
Finally, connect the dots between MAU shifts and your initiatives.
Overlay your MAU timeline with key events like campaign launches, feature releases, and pricing changes to identify what’s moving the needle.
This helps you tie outcomes back to actions, making MAU not just a metric, but a diagnostic tool for smarter growth decisions.
Applying MAU Insights Strategically
Tracking MAU for growth is one thing. Using it to drive smarter decisions is another.
Once you understand what your MAU trends reveal, the next step is to turn those insights into action across product, marketing, and strategy.
Inform Feature Prioritization and Product Roadmaps
MAU can be a powerful signal for where your product is (and isn’t) delivering value.
If MAU spikes after a new feature launch, that’s validation. If it drops when a core workflow changes, that’s feedback.
By pairing MAU with engagement data at the feature level, product teams can prioritize improvements that actually move the needle, and confidently de-prioritize those that don’t.
Tie Growth Levers to MAU
MAU often reflects how well your onboarding, reengagement, and retention levers are performing.
- If new users aren’t converting into monthly active users, revisit onboarding flows or early activation moments.
- If returning users are slipping, test reengagement tactics like reminders, new content drops, or loyalty rewards.
- If churn is high, explore lifecycle campaigns that deliver value just before users typically drop off.
Run Incremental Experiments
Think of MAU as a live feedback loop. You can experiment with interventions, like a product notification, a refreshed home screen, or new content, and watch how monthly activity responds.
Because MAU reflects user engagement metrics over a 30-day span, it’s ideal for measuring medium-term impact: not just whether users click once, but whether they return and stick around.
Build Forecasts and Growth Models
As MAU stabilizes, you can use it to model future growth scenarios.
Tracking month-over-month changes and retention cohorts helps you estimate how many active users you’ll have in 3, 6, or 12 months.
This becomes a foundation for revenue projections, staffing plans, and investor discussions.
Report MAU with Context and Caveats
Finally, when reporting MAU to stakeholders, especially investors or leadership, always pair the metric with context.
Share supporting indicators (like DAU/MAU ratio or retention rate) and note any changes in definitions or data collection methods.
MAU is valuable, but without transparency, it can be misinterpreted as raw “growth” when it might reflect seasonality or a data update.
Used thoughtfully, MAU isn’t just a vanity metric: it’s a strategic compass that connects user behavior with business growth, helping teams make decisions grounded in reality rather than instinct.
Example: MAU in Action
Let’s say you’re part of a mid-sized SaaS company that provides an automation tool for marketing teams.
For months, your MAU hovered around 18,000, but in Q2, you noticed a gradual 10% decline even though website traffic and sign-ups remained steady.
At first glance, it was unclear what was driving the drop. So your team dug deeper. You split MAU by cohort; specifically, acquisition channel and signup month.
The data revealed that while organic and referral users stayed consistent, users who came through paid ads in March were disengaging faster than expected. Their activation rate was half that of other cohorts.
That insight pointed to a problem not with your product, but with onboarding alignment.
Paid users were landing on a generic “get started” flow that didn’t match the use cases highlighted in the ads.
Your product and marketing teams collaborated to fix this disconnect. They:
- Created targeted onboarding checklists tailored to ad messaging.
- Added in-app tooltips and prompts guiding new users through key actions.
- Launched a reengagement email series aimed at dormant new signups from that cohort.
Within two months, MAU rebounded past its previous high; not only recovering lost users, but adding 15% growth.
The DAU/MAU ratio also improved, showing that new users weren’t just logging in once, they were returning regularly.
This kind of analysis demonstrates why MAU should never exist in isolation.
When you combine it with cohort data and behavioral metrics, it becomes a diagnostic tool that highlights where engagement is breaking down and where targeted fixes can unlock meaningful growth.
MAU Next Steps & Implementation Prompts

Whether you’re just starting to measure engagement or refining mature analytics, here are a few ways to put MAU into practice right away:
Audit Your Current MAU Definition and Logic
Revisit what “active” means in your context. Are you measuring logins, sessions, or meaningful actions?
Check that your definition reflects genuine engagement, not just surface-level activity, and that it’s applied consistently across tools and teams.
Review MAU Trends Over the Past 6-12 Months
Plot your MAU history alongside major product or marketing milestones.
Look for patterns: Do dips align with feature rollouts? Do spikes follow campaigns?
This exercise helps you separate signal from noise and identify long-term opportunities for growth.
Build or Update Your Engagement Dashboard
Create a centralized dashboard that tracks MAU, DAU/MAU ratio, and key cohort splits (like acquisition channel, region, or tenure).
Seeing these metrics side by side will make it easier to spot retention issues early and respond proactively.
Run One Small Experiment Aimed at Boosting MAU
Try a reengagement campaign, an onboarding tweak, or a feature announcement, and measure its impact on your MAU over a rolling 30-day window.
Small, controlled interventions build your team’s intuition about what actually drives sustained engagement.
MAU works best when it’s part of a continuous feedback loop: measure, test, learn, and repeat.
With the right data hygiene, consistent definitions, and habit of analysis, you’ll turn MAU into a true engine for growth.
Turn MAU Into Meaningful Growth
MAU is more than a number, it’s a narrative.
It tells you who’s showing up, how often, and whether your product is still delivering value where it counts. But like any metric, its power depends on how you use it.
Defining “active” users thoughtfully, tracking MAU alongside complementary metrics like DAU and retention, and digging into cohort behavior all turn surface-level data into actionable insight.
When MAU dips, it’s not just a red flag but a roadmap to where engagement is breaking down.
When MAU climbs, it’s proof that your product is building real, recurring habits.
With consistent measurement, contextual analysis, and a willingness to experiment, MAU can become a compass pointing you toward sustainable, user-driven growth.


.avif)


%25201.avif)


.avif)


.svg)
