


Most marketers spend hours debating dashboards. What if your data told you in seconds what to scale and what to cut?
That’s the promise of Northbeam’s benchmarks & stoplights. You define what “great” looks like by distilling your most profitable days.
Then your dashboard lights up green, yellow, or red against those standards—so you can scale winners, trim waste, and move on with your day.
No more debating which metric to trust. Just clear signals, grounded in your own best days, that turn data into decisions.
To see the full webinar I did on optimizing your ads, click the video below:
What Are Benchmarks & Stoplights?
Let me keep this simple.
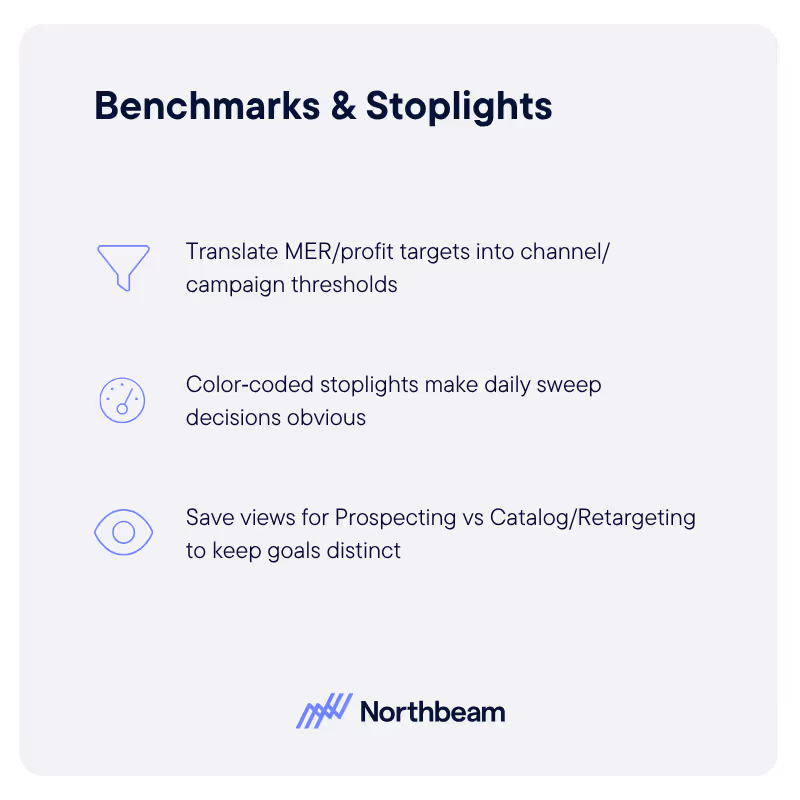
- Benchmarks are performance profiles pulled from your most profitable days, defined by you. They’re not averages from the internet—they’re your actual patterns when things go right.
- Stoplights are the green/yellow/red signals that compare today’s numbers to those profitable-day profiles, across platform, campaign, ad set, and ad levels. Green says “press the gas.” Yellow says “watch closely.” Red says “ease off.” This cuts through analysis paralysis and gets you acting fast, with confidence.
Watch the following clip for a quick explainer of Benchmarks and Stoplights:
Here’s why this matters: in a multi‑touch world, in‑platform metrics are biased toward their own channels.
Benchmarks and stoplights sit on top of a shared, multi‑touch source of truth, so the signal you get reflects how growth actually happens across channels—not just what one platform claims.
Setting Up Benchmarks
Here’s how I set this up so the signal is clean and actionable.
- Step 1: Identify your most profitable days over a meaningful window (I often see 6–12 months). Exclude promo and coupon spikes—you don’t want to benchmark to discount‑driven anomalies you don’t intend to repeat.
- Step 2: Segment by new vs. returning customers, by product categories/SKUs, and blended targets. That way, when the stoplight fires, you know if it’s aligned with your objective—acquisition, retention, or blended efficiency.
- Step 3: Store those performance profiles as reusable benchmarks. From there, stoplights render against them automatically wherever you work—platforms, campaigns, ad sets, and ads—so the scaling opportunities don’t hide inside a single top‑line number.
💡Pro tip: create saved views tailored to each role. Leadership keeps a high‑level blended view; media buyers get stoplights closer to the money (campaign/ad set/ad) for acquisition vs. retention; creative gets views that help validate concepts and hooks. Shared source of truth, role‑specific clarity.
Reading Stoplights In Action
Here’s the rulebook I run:
- Green = Scaling opportunity. If it’s green against the right benchmark (e.g., first‑time ROAS/CAC for acquisition), you can scale with confidence.
- Yellow = Caution/monitor. Hold, gather corroborating metrics, and confirm direction before you move budget.
- Red = Inefficiency → trim. Reduce spend, re‑allocate, or fix what’s broken (creative, targeting, or landing experience).
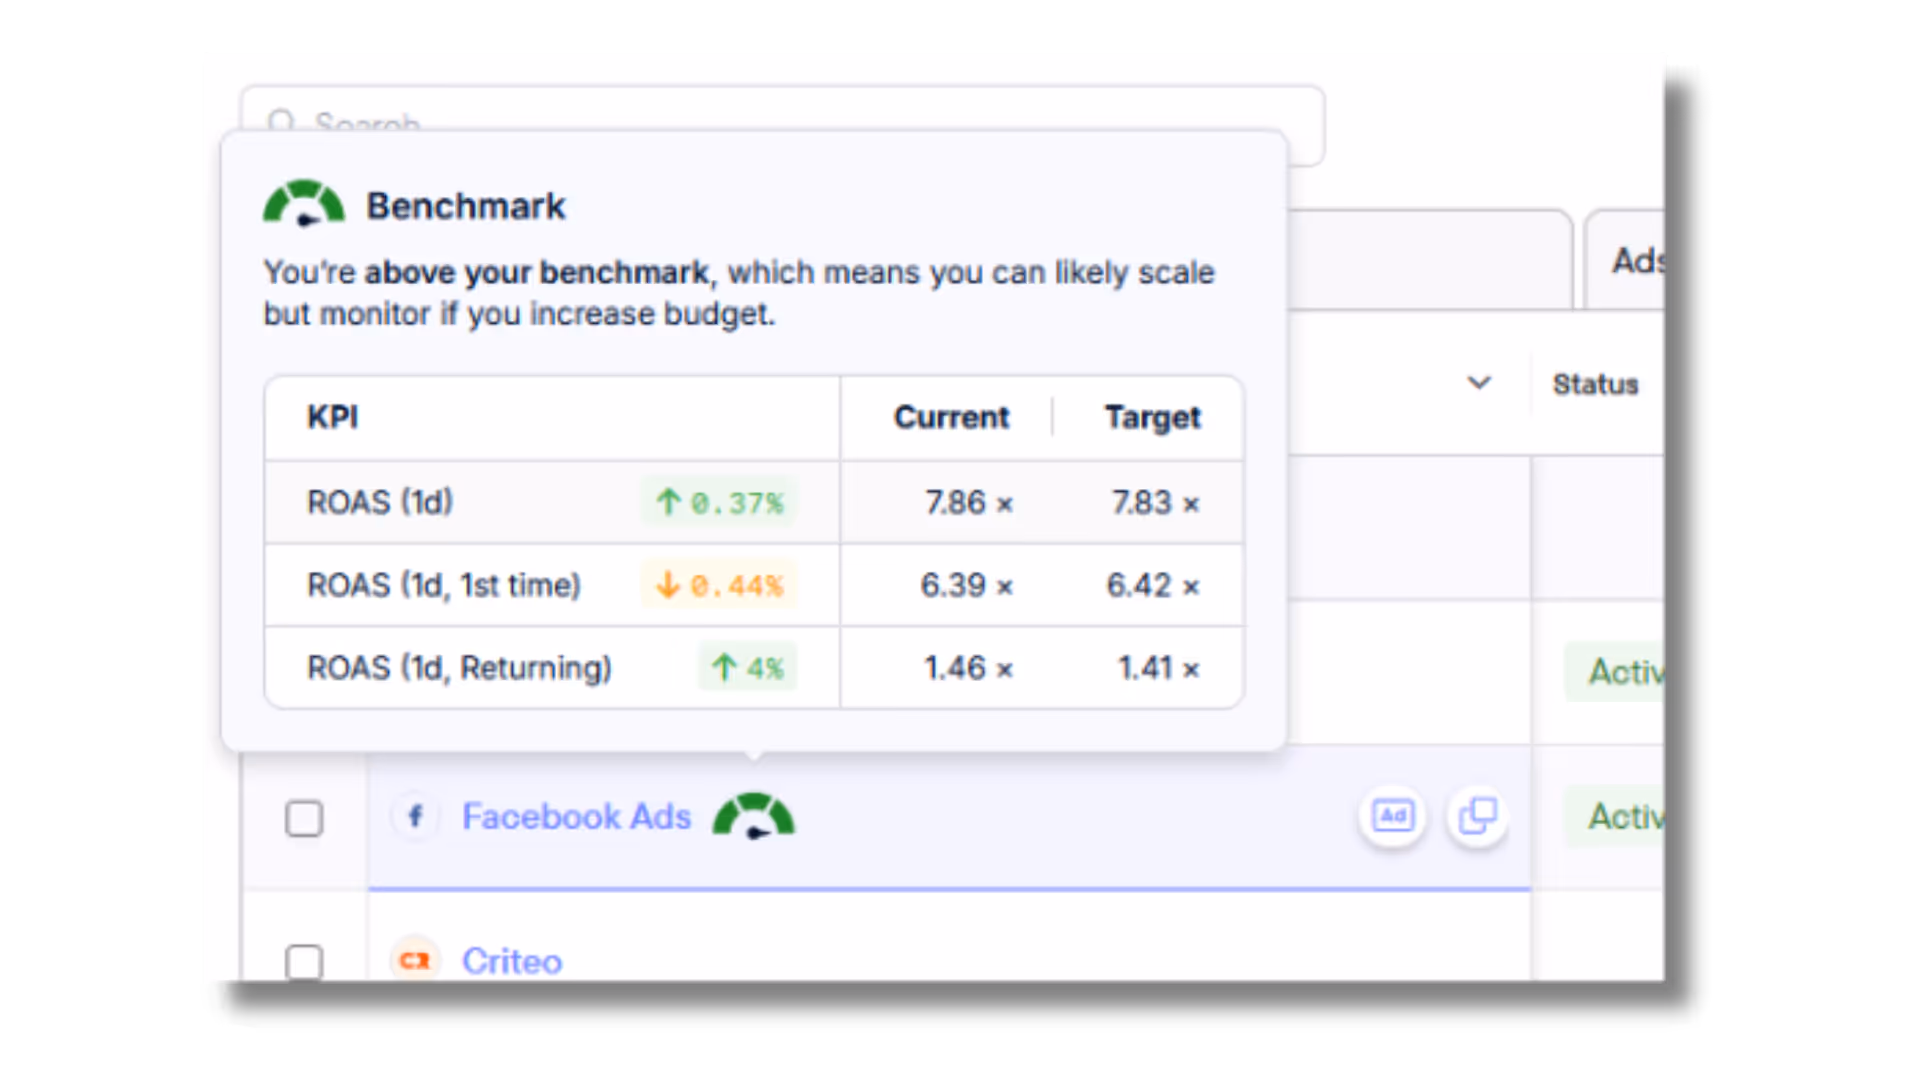
Now, let me address the moment that spooks a lot of teams. In my demo, (which you can see here) you’ll see Meta showing a 0.36 ROAS in Northbeam, while in‑platform showed ~2.7.
With stoplights aligned to the brand’s benchmarks, we could see Meta was actually on track. Not because we’re sugarcoating—because we’re measuring against a multi‑touch, profitable‑day baseline that reflects how the business really makes money.
The quick takeaway: don’t let a scary number force the wrong move. Read it through your benchmarks and stoplights before you decide.
Daily Workflow With Stoplights
I want your daily pass to feel like a repeatable loop you can run forever. Here’s the flow I coach teams to use:
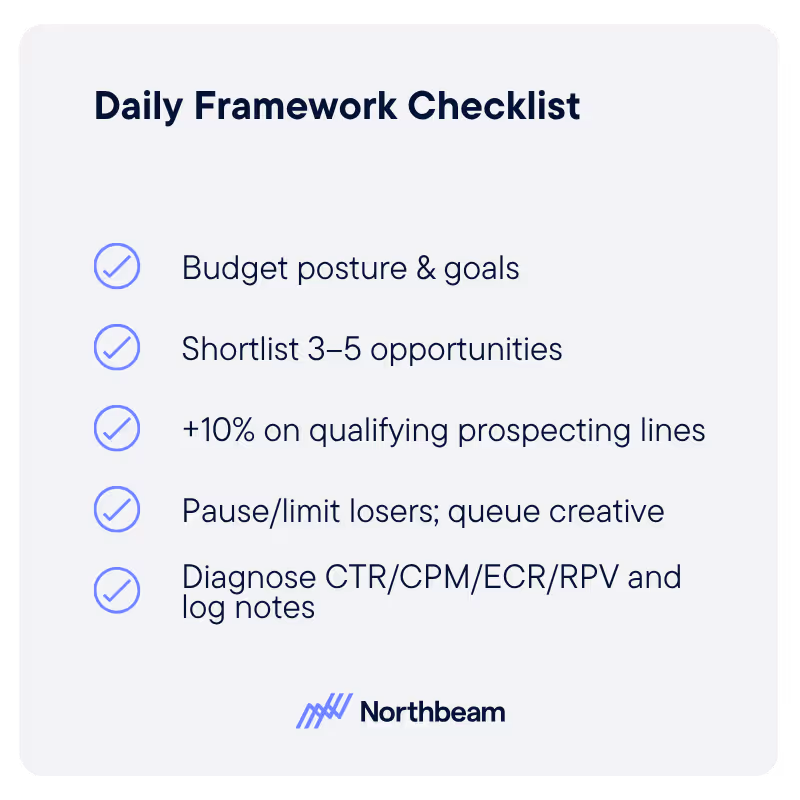
1. Gut Check Your Goal
Are you optimizing for new customer acquisition, reviewing a promo, checking a new category, or validating creative? When you know your goal, you know which stoplights matter most today (first‑time vs. blended vs. returning).
2. Open Your Saved View and Scan Top‑Down
Start at platform/channel stoplights, then drill to campaigns, ad sets, and ads. You’ll spot scale pockets inside an overall yellow, and see waste that’s hiding under a blended green.
In this clip from the webinar, you can see how we quickly scan the performance of ads and adsets as part of our optimization framework.
3. Apply the Scaling Rules
If it’s green against the right benchmark, scale confidently. If it’s red, trim. If it’s yellow, hold and confirm with supporting metrics (CTR, CPM, CPC, conversion rate, new customer percent, revenue per visit). Keep it simple, that’s how you move fast without being reckless.
4. Diagnose with Supporting Metrics
Low CTR, high CPM? Creative/targeting mismatch; fix the angle, hook, or audience.
Strong clicks, weak first‑time conversion? Ad‑to‑landing mismatch—align the promise that earned the click with the page that receives it.
Good conversion, low revenue per visit? Improve the offer—bundles, cross‑sells, post‑purchase upsells, or price testing.
Use red to find friction; use green to fund iteration.
In the webinar, we discussed the kinds of metrics you can review as part of your strategy to optimize your campaigns more effectively, which you can see in the clip here:
5. Re‑Check and Validate
Come back tomorrow or next week, look at the stoplights again, confirm your moves, and repeat. This is how you escape one‑off heroics and build durable performance habits.
Attribution Posture
A quick note on why this works so well with Northbeam’s attribution settings.
I recommend a conservative posture; clicks‑only model on a one‑day window, and accrual reporting (tie revenue to the timestamp of the touchpoint).
This strips inevitable lower‑funnel catchers (brand search, email/SMS, direct) from over‑claiming and pushes credit back to the actual demand generators. It also prevents “false flags” from cash‑mode spikes (like an email send) that weren’t the real driver. Your benchmarks depend on this integrity; your stoplights are only as trustworthy as the accounting underneath.
Conclusion
Benchmarks and stoplights compress decision time and turn your best days into a daily guidance system. You define winning based on reality.
The dashboard lights up with simple, trustworthy signals. And your team moves budget with speed and conviction—scaling what’s working and cutting what isn’t, without the endless debate.
Try Northbeam for yourself. Build the daily loop once, then run it every morning for faster, smarter optimization.
To watch the full webinar, click here. Additionally, you can download our handy guide to keep at your side for when you're optimizing your campaigns, straight from the playbook our media strategists run. Download it for free here.


.avif)


%25201.avif)


.avif)


.svg)
