


Building a strong marketing funnel can sound like something reserved for data scientists or growth hackers, but it’s just a structured way to understand how people find, engage with, and buy from your brand.
This guide breaks the process of how to make a funnel down step by step, from strategy to structure, mapping to measurement.
You’ll learn how to define clear stages, assign content and offers to each one, track real performance data, and optimize over time.
Along the way, we’ll share common mistakes to avoid, tools to make the job easier, and an example of how a D2C brand turned funnel mapping into measurable growth.
The goal is to help you design a funnel that drives predictable, scalable conversions and gives you a clear, adaptable framework for future campaigns.
The Modern Marketing Funnel
The marketing funnel isn’t dead, it just evolved.
What used to be a neat, linear path from awareness to purchase now looks more like a web of overlapping touchpoints. Today’s buyers don’t move step-by-step; they bounce between channels, revisit old pages, and rely on peer recommendations as much as ads.
That makes understanding and mapping your funnel more important, not less.
The classic marketing funnel design is giving way to “influence maps.” These are frameworks that show how different moments of interaction shape a buyer’s decision over time.
Rather than treating every customer journey as a straight line, influence maps capture how awareness, consideration, and conversion loops feed into one another across social, search, email, and word-of-mouth.
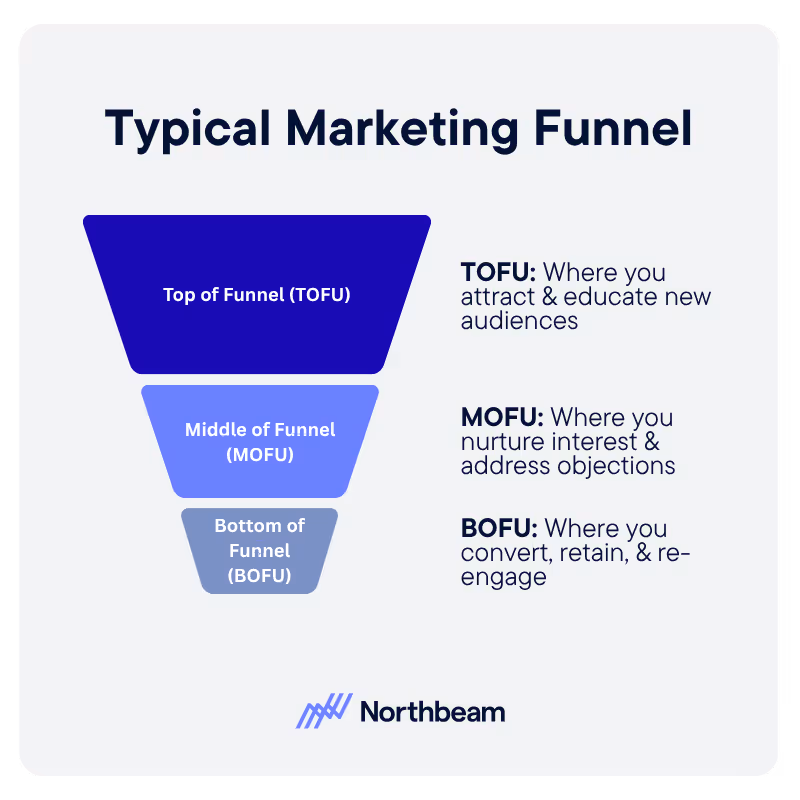
At its core, though, the funnel still describes the same behavioral journey:
- Top of funnel (TOFU): where you attract and educate new audiences.
- Middle of funnel (MOFU): where you nurture interest and address objections.
- Bottom of funnel (BOFU): where you convert, retain, and ideally re-engage.
Each stage has its own goal, content, key performance metrics, and, most importantly, its own leakage points where users drop off or disengage.
A well-mapped funnel gives you a shared language for your marketing strategy. It shows where people are falling off, which touchpoints actually drive conversions, and where to invest in testing and optimization.
When done right, funnel mapping transforms scattered marketing activities into a measurable, repeatable system for growth.
Foundational Setup: Before You Map
Before you start sketching boxes and arrows, it’s worth taking a step back. A great funnel isn’t built from templates, it’s built from clarity.
The strongest funnels start with a deep understanding of what success looks like, who you’re guiding, and where your current process falls short.
Here’s your funnel mapping guide for digital marketing:
1. Clarify Your Objectives and Conversion Goals
Decide what “winning” means for your business as you map out your funnel for lead generation and beyond. Is it a newsletter signup? A demo request? A completed purchase?
Defining this up front shapes everything else, from your messaging and targeting to how you measure success.
Without a clear conversion goal, even the best-designed funnel won’t tell you much.
2. Understand Your Audience and Journey
The funnel should reflect how your audience actually thinks and behaves.
Map out key personas, their motivations, information needs, and the objections that hold them back. What triggers a decision? What makes them hesitate?
The better you understand those nuances, the easier it is to design touchpoints that feel intuitive rather than forced.
3. Audit Existing Data and Performance
If you already have traffic or conversion data, treat it like a roadmap of what’s working and what’s not.
Look for drop-offs between ad clicks and signups, or between product pages and checkout. These “leaky” moments are where your funnel can make the biggest impact.
4. Decide Funnel Depth and Naming Conventions
Not every business needs a five-stage masterpiece. Some funnels work perfectly well with three simple stages, while others benefit from adding loyalty, referral, or re-engagement layers.
Choose a structure that fits your model and name each stage in plain language that your team can rally around.
Getting these foundations right ensures that when you finally start mapping, every stage of your funnel has purpose, data behind it, and a clear path to conversion.
How to Make a Marketing Funnel (Step-by-Step Mapping)
Now for the fun part: turning your funnel strategy into a productive workflow.
Whether you’re starting from scratch or refining an existing setup, the key is to treat this as a living system, not a one-and-done diagram.
Here’s a step-by-step guide to mapping your funnel:
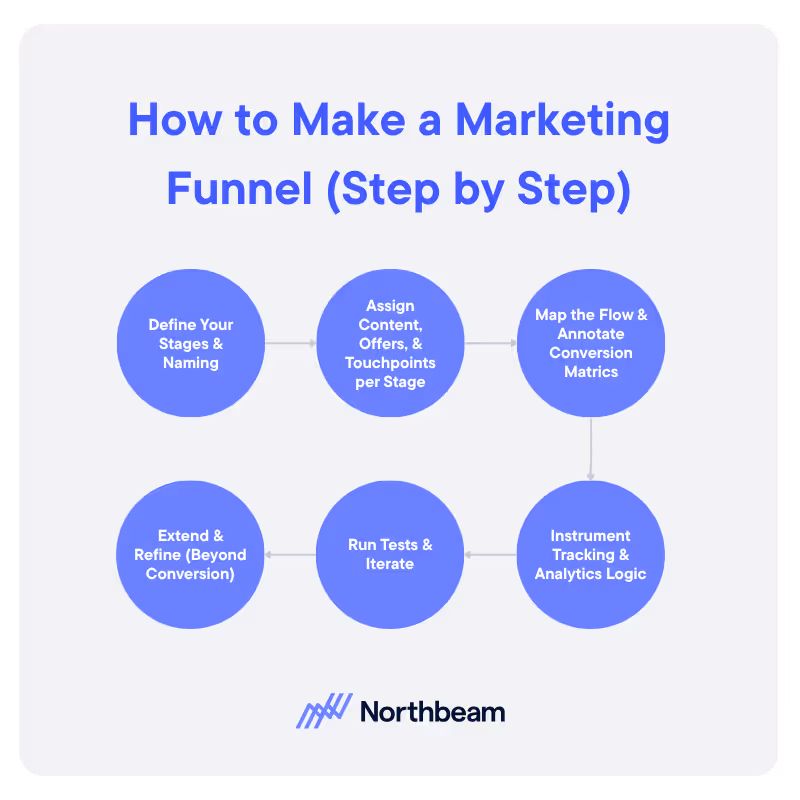
1. Define Your Stages (and Naming)
Start by outlining the key phases of your funnel. The classic version looks like this:
- Awareness
- Interest
- Consideration
- Conversion
- Retention
But don’t feel boxed in. The goal is to capture the mindset and behavior of your users at each step, not just replicate generic marketing terms.
For example:
- Awareness might mean “Discover” for a lifestyle brand or “Evaluate” for a B2B product.
- Retention could be reframed as “Delight” or “Advocacy” depending on your goals.
The important thing is that every stage has a clear handoff: a moment when a user takes an action that moves them forward.
2. Assign Content, Offers, and Touchpoints Per Stage
Each stage of your funnel should feel like a natural next step in the user’s journey.
To make that happen, plan content, offers, and channels that meet people where they are:
- Top of funnel: educational blog posts, paid social ads, SEO content, and influencer collaborations.
- Middle of funnel: comparison guides, webinars, demos, or email sequences that build trust.
- Bottom of funnel: pricing pages, testimonials, case studies, and limited-time offers that help users commit.
In modern funnels, this often means building dynamic “feeds” rather than static paths so your content catalog, ad audiences, and product recommendations can all adapt automatically to a user’s behavior.
3. Map the Flow and Annotate Conversion Metrics
Once you’ve listed your stages and touchpoints, sketch out the flow.
Create a simple funnel diagram with arrows showing transitions between each stage, and annotate it with the metrics that matter:
- Conversion rate per stage
- Drop-off percentage
- Traffic or volume at each step
This visual snapshot helps you quickly spot where your funnel is leaking and where optimization will have the biggest impact.
4. Instrument Tracking and Analytics Logic
Funnels are only as good as the data behind them. Set up the right tracking from day one:
- Define key events: pageviews, clicks, form submissions, video completions, or email opens.
- Use funnel or cohort analysis tools to see how users move between stages.
- Build a dashboard that visualizes flow, bottlenecks, and conversion trends over time.
This instrumentation ensures your funnel isn’t just a diagram but a measurable engine you can actually optimize.
5. Run Tests and Iterate
Once your funnel is live, expect it to evolve. Launch a minimum viable funnel (MVF) first, even if it’s imperfect. Then use real data to improve it.
Try to:
- Test one element at a time: the offer, CTA placement, or messaging tone.
- Use A/B or split testing to see which variant moves users further down the funnel.
- Revisit assumptions; the real journey often looks different from what you mapped.
Every iteration teaches you something new about how your audience behaves.
6. Extend and Refine (Beyond Conversion)
A strong funnel doesn’t stop at “thank you for your purchase.”
Post-conversion touchpoints can be just as valuable:
- Retention: onboarding emails, loyalty programs, or user communities.
- Expansion: cross-sell and upsell opportunities.
- Re-engagement: win-back campaigns or referral programs.
Over time, your funnel becomes less of a straight line and more of a loop: a system that feeds continuous growth and customer loyalty.
Common Mistakes to Avoid
Even the best funnel strategy can go sideways if you overthink it, or worse, never evolve it.
Below are some of the most common traps teams fall into when establishing their marketing funnel design, and how to steer clear of them.
Overcomplicating the Funnel
More stages don’t automatically mean more insight.
It’s easy to get carried away mapping micro-steps like “clicked CTA” or “visited pricing page,” but too much granularity makes your funnel impossible to manage.
Start simple, validate what works, and add complexity only when the data demands it.
Treating the Journey as Strictly Linear
Real customer behavior rarely follows a straight path. People skip steps, return later, or convert from unexpected touchpoints.
If your funnel assumes a one-way progression, you’ll miss valuable signals from loops and lateral moves, like re-engagement or cross-channel conversions.
Misaligned Messaging
A common sign of a weak funnel is content that doesn’t match where users actually are in their decision process.
If you’re hitting cold audiences with hard-sell CTAs or serving introductory blog posts to ready-to-buy leads, your conversion rate will stall. Always align messaging to mindset.
Missing Instrumentation
You can’t optimize what you can’t measure.
When stage transitions aren’t tracked properly, like if email clicks or demo requests aren’t tied to a specific funnel stage, your data will have blind spots.
Fill those gaps early with clear event tracking and analytics logic.
Launching Without a Testing Plan
Your first funnel is just a hypothesis. Without A/B testing or regular reviews, you’re guessing at what’s working.
Build testing into your process from the start: small experiments beat sweeping changes every time.
Neglecting Post-Conversion Stages
Retention, referral, and upsell steps are where long-term value comes from. Many funnels stop at the sale, leaving repeat revenue on the table.
Keep the conversation going: it’s easier to re-engage an existing customer than win a new one.
Keeping a Static Funnel
Customer behavior, algorithms, and channels change constantly. Your funnel should evolve, too.
Revisit it quarterly to check for new drop-off points, emerging audience patterns, or outdated messaging. A living funnel is a profitable funnel.
Tools, Frameworks & Advanced Considerations
Once your funnel framework is in place, the right tools can turn it from a static diagram into a living, data-driven system.
From visualization software to analytics platforms, here’s how to build a modern funnel stack that actually works.
Tools for Visualization and Mapping
Start by getting your funnel out of your head and onto the screen. Visual tools like Miro, Lucidchart, or Funnelytics make it easy to map each stage, touchpoint, and handoff.
A visual layout helps teams spot gaps, align on definitions, and understand how campaigns fit into the bigger picture.
Pro tip: Keep your diagram simple enough for a newcomer to grasp in under a minute. If it looks like a subway map, it’s too complicated.
Analytics Platforms with Funnel Modeling
Once your funnel is mapped, you’ll need analytics tools to track how users actually move through it.
Platforms like Google Analytics 4, Mixpanel, and Amplitude let you:
- Build custom funnel reports and measure conversion rates at each stage
- Visualize drop-offs and time-to-convert
- Segment users by source, campaign, or cohort
These tools make it easy to connect real user behavior to your funnel hypotheses.
Funnel Optimization and Experimentation
Optimization platforms allow you to test changes directly within your funnel.
You can:
- A/B test messaging, CTAs, or page design
- Identify high-impact improvements based on lift in conversion rates
- Automate winning variants into your live campaigns
Even small tweaks in a key stage (like reducing form fields or simplifying copy) can have outsized effects on total conversion.
Cohort and Breakdown Analyses
Funnels don’t perform the same for everyone. Use cohort analysis to break down performance by segment. For example, new vs. returning users, or organic vs. paid traffic.
Cohort insights help you tailor content and identify underperforming audiences that need special attention.
Advanced Funnel Methods
As your data matures, you can move beyond traditional funnel modeling into adaptive, predictive systems:
- Predictive funnels: use machine learning to forecast conversion probabilities and flag at-risk users.
- Adaptive funnels: automatically adjust content and next steps based on real-time behavior.
- Dynamic pathing: recognizes that not all users follow the same order and models non-linear journeys accordingly.
These approaches turn funnels into flexible systems that learn and improve continuously.
Cross-Channel Orchestration
Finally, ensure your funnel flows seamlessly across channels. A prospect who clicks a paid ad, reads a blog, and signs up for a webinar should feel like they’re on one cohesive journey, not three separate ones.
Centralize your data, align messaging, and use connected tools (like CRM integrations or marketing automation platforms) to bridge the gaps between touchpoints.
Example Funnel Walkthrough: D2C eCommerce
To see funnel mapping in action, let’s look at a hypothetical D2C skincare brand named LumaCare that sells cruelty-free moisturizers and serums online.
When the LumaCare team first started, they had strong traffic but inconsistent sales. They decided to map and optimize their funnel to understand where users were dropping off and how to fix it.
Here’s what they did:
1. Define Audience and Funnel Stages
LumaCare’s team defined their funnel around five simple stages:
2. Create Content, Offers & Touchpoints
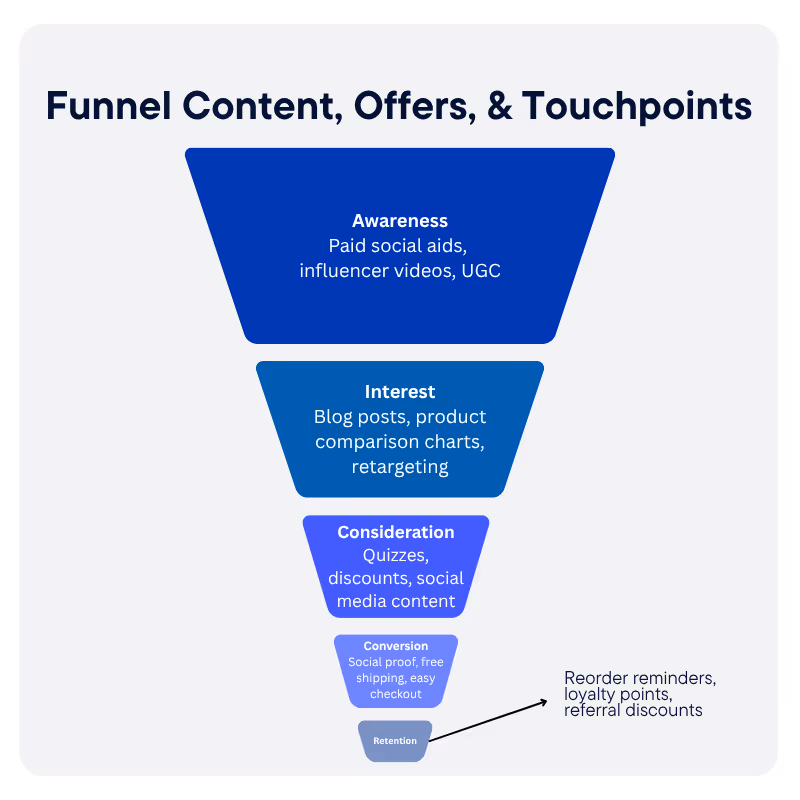
For each stage, they listed targeted content and offers:
- Awareness: Paid social ads, influencer videos, and UGC TikToks showcasing before/after results.
- Interest: Blog posts, product comparison charts, and retargeting ads linking to customer stories.
- Consideration: “Find Your Routine” quiz, 10% off first order email, and Instagram stories with skincare tips.
- Conversion: Optimized product pages with social proof, free shipping thresholds, and a one-click checkout.
- Retention: Automated reorder reminders, loyalty points, and referral discounts.
3. Map Flow & Identify Leaks
Once mapped visually, the data revealed a major drop-off between Consideration and Conversion: nearly 40% of email subscribers never returned to the site.
By adding retargeting ads that showcased each user’s quiz results (“Here’s your custom LumaCare routine”), conversion rates rose from 2.1% to 3.6%, and average order value increased by 15%.
4. Track & Instrument
The team used Google Analytics and other marketing intelligence tools to track:
- Traffic by channel and UTM
- Quiz completions and email signups
- Add-to-cart vs. checkout completions
- Repeat purchase rate
Custom dashboards displayed conversion rates by stage, making it easy to see how each channel performed and where to focus testing.
5. Test & Iterate
Every quarter, LumaCare ran one new test per funnel stage, like changing creative formats for Awareness or simplifying the quiz for Consideration.
Over six months, this consistent testing cycle helped them cut drop-off by 28% and raise customer lifetime value by 22%.
6. Extend the Funnel Beyond Conversion
The final optimization came after purchase. The brand created a “Glow Points” loyalty program and sent reorder prompts when customers’ average product usage time ran out.
This small retention loop turned one-time buyers into brand advocates, closing the loop and fueling the top of the funnel with referral traffic.
The takeaway: By treating their funnel as a living system, LumaCare built a predictable growth engine that turned awareness into advocacy.
Put Your Funnel Map Into Action
You’ve got the framework. Now it’s time to put it to work.
Funnel mapping isn’t just a planning exercise; it’s a habit that keeps your marketing grounded in data and aligned with real customer behavior.
Start simple:
- Sketch your funnel. Even a rough version on paper helps you visualize how people move from discovery to conversion.
- Spot one weak transition. Look for where engagement or conversion drops most sharply. That’s your first test point.
- Design an experiment. Try a new offer, update messaging, or simplify a step in the journey. Measure what changes.
- Create a funnel dashboard. Track key metrics (volume, conversion rate, and drop-off by stage) so you can see progress at a glance.
Once you’ve built your first version, keep iterating. The best funnels evolve alongside your audience, product, and market.
When you define clear stages, align content and data, and test continuously, you transform marketing from guesswork into a repeatable growth engine.


.avif)


%25201.avif)


.avif)


.svg)
