


Marketing automation is supposed to make everything easier: fewer manual emails, more consistent follow-ups, smoother nurture flows.
But once a drip campaign is launched, it often becomes a black box. Is it working? Which emails actually matter? Is it driving pipeline or just sending emails into the void?
Without clear reporting, you’re guessing. And guessing is expensive.
Modern growth teams need visibility, attribution, and proof, not just consistent activity. Reporting on your drip campaigns is the only way to know whether your automations are generating real business value.
This article walks through reporting on marketing automation performance and providing the ROI of drip email campaigns.
You’ll learn which metrics matter (engagement, conversion, revenue, attribution, efficiency), how to build a reporting framework and dashboard, how to connect drip activity to real conversions, and how to optimize sequences based on data.
You’ll also see a sample case study of how better reporting can improve conversion rates and ROI. By the end, you’ll have clear steps you can take to audit, measure, and improve your automated drip campaigns.
Why Reporting Matters for Drip Campaigns
Marketing automation is powerful. It saves time, scales your outreach, and ensures every lead gets the right message at the right moment.
But automation alone doesn’t guarantee impact. Without strong reporting, you have no way of knowing which sequences are actually moving people through the funnel and which ones are just running in the background.
Good marketing automation reporting turns drip campaigns from “set it and forget it” workflows into measurable growth levers.
A major reason reporting matters is attribution. Drip campaigns rarely operate in isolation; they touch the same users who are seeing ads, visiting your website, talking to sales, or signing up for demos.
If your reporting can’t connect drip activity to downstream conversions and revenue, you’ll never truly understand the incremental value your automations are generating.
Linking enrollment, engagement, and follow-through actions back to revenue outcomes is how you move from email metrics to business metrics.
There’s also a growing business expectation: stakeholders want proof of performance.
“We sent five emails” isn’t enough anymore. Leadership teams want to see which flows influence pipeline, shorten time-to-value, or reduce manual follow-up.
Yet research shows that only approximately 10% of marketers said they could effectively measure program impact. That’s the difference between teams who can defend their automation investment and teams who can’t.
Strong reporting closes that gap. It gives you visibility, attribution clarity, and credibility, the three ingredients that turn drip campaigns into provable ROI engines.
Defining the Reportable Metrics for Drip Campaigns
Before you can prove the impact of your drip campaigns, you need clarity on which metrics actually matter.
Strong reporting frameworks blend engagement, conversion, revenue, attribution, and efficiency indicators into a single view that shows not just what users did, but how that activity influenced the business.
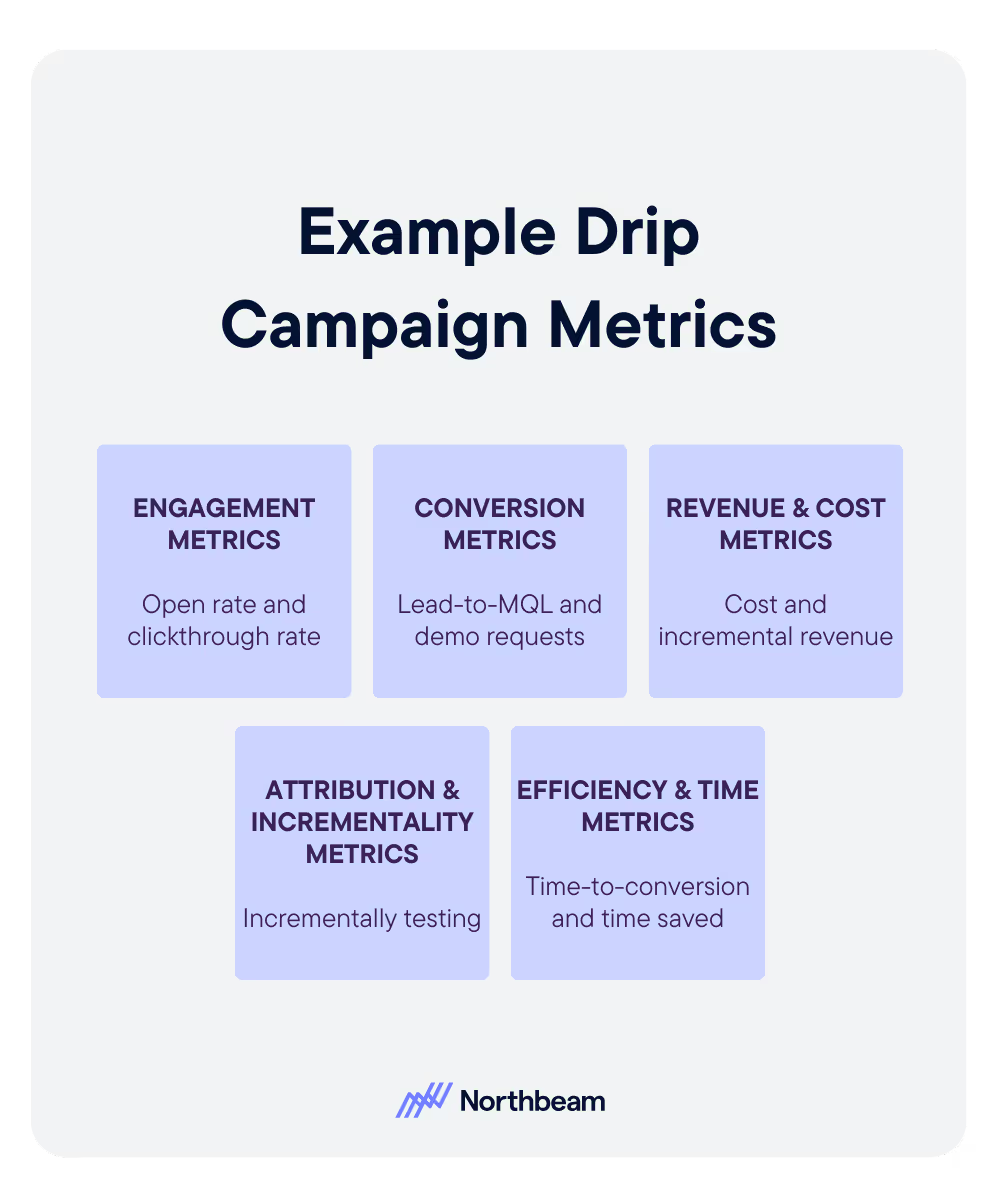
Engagement Metrics
Engagement metrics like open rate, click-through rate (CTR), and interactions with individual steps in the sequence help you understand whether the content resonates and where users fall off.
These metrics diagnose friction and message relevance, serving as early signals of sequence health.
Conversion Metrics
Conversion metrics translate engagement into outcomes: lead-to-MQL progression, MQL-to-SQL movement, demo requests, purchases, or any downstream action directly tied to the drip.
These metrics reveal whether the sequence actually influences pipeline, not just inbox behavior.
Revenue & Cost Metrics
To quantify ROI, you need a clear view of both sides of the equation: the cost of the campaign (platform spend, content creation, staffing) and the incremental revenue it generates.
Without these metrics, reporting risks overemphasizing activity rather than profitability.
Attribution & Incrementality Metrics
Drip campaigns sit inside complex, multi-touch customer journeys.
Drip campaign attribution and reporting best practices (supported by tracking parameters, unique identifiers, and closed-loop reporting) help isolate the drip’s actual contribution to conversions.
Incrementality testing (such as holdout groups) strengthens confidence that results didn’t happen by chance or via other channels.
Efficiency & Time Metrics
Efficiency metrics capture how automation improves operations. Think time-to-conversion, reductions in manual follow-ups, and the total scale of users enrolled in the sequence.
These metrics show the internal value of automation, not just the external performance.
Across all categories, the golden rule is this: your reporting must ultimately roll up to business outcomes.
CAC, LTV, and ROI are the numbers stakeholders care about. The more directly your metrics connect to these outcomes, the stronger your case for continued investment in marketing automation.
Building a Reporting Framework & Dashboard for Your Drip Campaigns
A strong reporting foundation turns your drip campaigns from opaque workflows into measurable, optimizable growth assets.
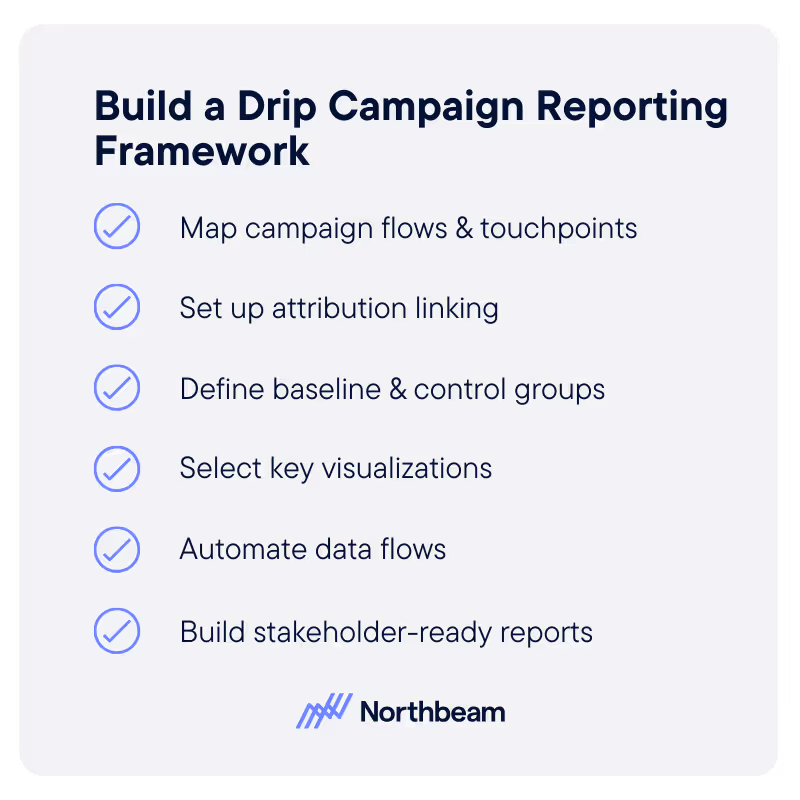
These are the core components your framework needs:
1. Map Campaign Flows and Touchpoints
Start by visualizing the full journey: where the drip sits in the funnel, what triggers entry, and which actions you expect users to take.
Clear mapping ensures your reporting aligns with the actual user path and helps you understand which moments matter most.
2. Set Up Attribution Linking
Connect drip enrollments to downstream behaviors like ad clicks, site visits, demo requests, and purchases.
Attribution depends on clean tracking (unique identifiers, synced platforms, structured tagging, etc.) so you can isolate the drip’s influence instead of losing it in the noise of multichannel activity.
3. Define Baseline and Control Groups
To measure true incrementality, build a control cohort that does not enter the sequence.
Comparing performance between exposed and unexposed groups allows you to attribute lift confidently, instead of guessing whether a conversion would have happened anyway.
4. Select Key Visualizations
Strong dashboards rely on visual clarity. Include funnel drop-off charts (enrollment → email 1 → email 2 → conversion), revenue-over-time by cohort, cost-versus-revenue curves, and efficiency indicators like time-to-conversion.
These visuals quickly show what’s working and where users fall away.
5. Automate Data Flows
Centralize data from your CRM, email automation platform, analytics tools, and attribution system.
Automated pipelines ensure your reporting stays timely, accurate, and consistent; no more manual CSV exports or out-of-date dashboards.
6. Build Stakeholder-Ready Reports
Finally, translate your metrics into insights. Stakeholder-facing reports should include segmented views (by audience, channel, or campaign), KPIs tied to business outcomes, and a simple narrative: what worked, why it worked, and what you’re doing next.
This is where reporting becomes operationally useful, not just informational.
Ensuring Drip Campaigns Deliver ROI & Attribution Clarity
To prove the value of your automated sequences, your drips need more than good content. They need to be engineered for measurable performance from the start.
That means clear triggers, thoughtful segmentation, consistent follow-ups, and reporting systems designed to track the full economic impact of every touch.
Make sure to follow these best practices:
Set Up Drip Campaigns With Performance in Mind
High-performing drips start with strong architecture. Define who enters the sequence, why they enter, and what actions you expect them to take.
Use segmentation to ensure the right users get the right message at the right time, and build timely follow-ups that encourage progression instead of passive engagement.
When the structure is intentional, the reporting becomes meaningful.
Attribute Conversions in Multi-Touch Journeys
In reality, users interact with ads, pages, emails, and sales outreach long before they convert, which means attribution rules matter.
Decide whether you’ll use first-touch, last-touch, linear, or weighted multi-touch models, and make sure your system recognizes drip events as legitimate touchpoints.
Proper tagging and consistent identifiers keep your drips from disappearing in attribution black holes.
Compare Cost vs. Benefit, Not Just Engagement
Opens and CTRs can make a campaign look successful, but they don’t prove ROI. What matters is the incremental revenue generated by the drip compared to the cost of building, running, and maintaining it.
Calculating ROI forces you to evaluate whether the sequence is an essential growth engine or simply an automated expense.
Build Continuous Optimization Loops
Strong reporting isn’t static, it’s a feedback system. Use your dashboard to identify where users drop off, which segments underperform, and which emails fail to convert.
Then iterate: adjust content, tweak timing, refine targeting, or split test your highest-friction steps. Continuous optimization keeps the drip aligned with user behavior and business goals.
Account for Cross-Channel Interactions
Drip campaigns rarely operate alone. A user might click an ad, join a drip, revisit your site, and schedule a demo all within the same journey.
Your reporting should reflect this reality. Map how paid media, website activity, and lifecycle messaging interact, and ensure your attribution model credits the drip for the role it plays in driving users toward conversion, not just the final click.
Challenges & Pitfalls in Reporting Drip Campaign Performance
Even the most sophisticated automation programs run into obstacles when it comes to capturing accurate, actionable performance data.
Here are some of the most common challenges teams face and why they matter:
Data Silos and Disconnected Systems
Your email platform, CRM, analytics tools, and attribution software don’t always communicate cleanly. When data sits in separate systems, it becomes difficult to stitch together a full-funnel view of how users move from drip engagement to conversion.
This disconnect often leads to incomplete reporting or misleading conclusions.
Attribution Complexity
Drip campaigns rarely operate in isolation. Isolating the incremental value of a drip campaign in this multichannel environment is inherently tricky, especially without clear attribution rules and consistent identifiers.
Difficulty Measuring Long-Tail or Indirect Impact
Not every drip exists to drive an immediate purchase. Some sequences influence retention, expansion, onboarding success, or long-term product adoption.
These outcomes can be harder to quantify, and they don’t always map neatly to traditional ROI formulas, which creates a risk of undervaluing high-impact lifecycle flows.
Over-Focus on Soft Metrics
Open rates and click-through rates can provide useful directional insights, but they don’t prove business impact. Teams that rely too heavily on soft metrics risk optimizing emails instead of optimizing revenue.
Manual Reporting and Stale Data
When reporting requires manual exports, spreadsheet cleanup, or piecing together metrics from multiple tools, insights arrive too slowly to guide real optimization.
Delayed or inconsistent data means missed opportunities to fix drop-offs, refine segmentation, or improve timing.
Implementation Cost vs. Perceived Value
Robust reporting requires tracking, integrations, and aligned data structures, all of which take time and resources. Teams may hesitate to invest in this infrastructure unless the value is clear.
Without adequate setup, though, automation programs often underperform simply because their impact isn’t visible.
Example Case Study: B2B SaaS Company
To illustrate how effective reporting transforms drip campaigns, let’s look at a sample scenario from a B2B SaaS company running a 14-day product trial.
The team built a welcome-drip sequence triggered at signup: a five-email flow designed to guide new users toward activation milestones and, ultimately, a demo request.
Once the sequence had been live for a few weeks, the reporting dashboard surfaced a clear issue: a steep drop-off between enrollment and the second email.
Most users opened the first message but ignored the follow-ups, which meant they weren’t progressing toward activation.
By layering in segmentation (separating enterprise prospects from smaller teams), and adjusting the timing of the second and third emails, the team was able to deliver more relevant content to each group at the right time.
Attribution also played a critical role here. By tagging every email interaction with a unique user ID and syncing activity into the CRM, the team connected drip engagement to downstream actions like demo requests and closed deals.
A multi-touch attribution model clarified the drip’s role in the broader journey, showing that users who completed at least three emails converted at a meaningfully higher rate.
The impact of this tightening-up process was immediate. After the segmentation and timing updates, the conversion rate from trial to demo increased by 30 percent among users who entered the drip.
The improved sequence also delivered stronger economics: the campaign’s cost-to-revenue ratio improved by 25 percent once optimization efforts kicked in.
A glance at the reporting dashboard told the story visually. Funnel drop-off charts revealed where attention declined. A cost-versus-revenue graph illustrated the financial lift over time. A heatmap of segment performance showed which audiences responded best, helping the team prioritize future improvements.
This example shows how a well-instrumented drip campaign becomes a measurable growth lever, and how the right reporting framework can surface the insights needed to unlock real ROI.
Actionable Next Steps for Your Team
Once you’ve built a clear reporting foundation, the final step is putting it into practice.
This checklist can help you operationalize your insights, improve drip campaign performance metrics quickly, and make drip campaigns a measurable contributor to growth:
- Audit your current drip reporting setup: List every active sequence, its data sources, the metrics you track today, how attribution works, and whether you have an up-to-date dashboard.
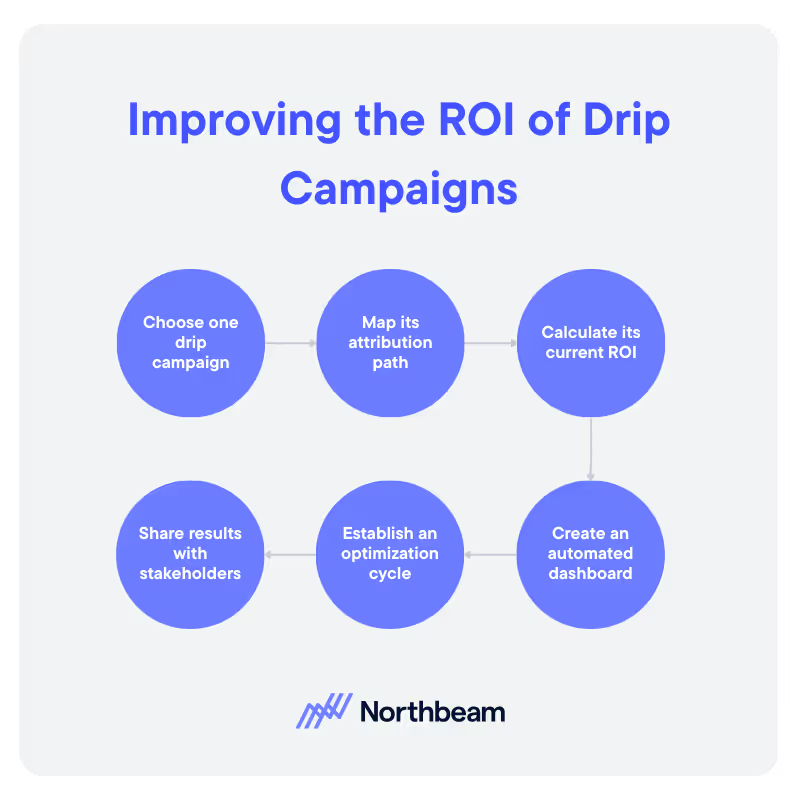
- Choose one drip to improve and map its attribution path: Ensure you can connect enrollment → engagement → action → revenue in your analytics or attribution system. If any link in that chain is missing, fix it.
- Calculate ROI for at least one existing campaign: Define the campaign’s full cost (platform, content, staffing), measure its incremental revenue, and compute ROI using (Revenue – Cost) / Cost. This becomes your baseline.
- Create or refine a fully automated dashboard: Set it to update without manual intervention and surface the essentials: enrollments, drop-offs, conversions, revenue, ROI, and segment-level differences.
- Establish a recurring optimization cycle: Add a weekly or bi-weekly review to evaluate performance, identify drop-offs, run experiments, and continuously refine content, timing, and segmentation.
- Share results with stakeholders in a business-focused format: Highlight pipeline influence, revenue lift, and efficiency gains, not just email engagement. Keep the narrative concise and tied directly to business impact.
Bringing It All Together
Strong drip campaigns need to perform, and the only way to prove that performance is through clear, consistent reporting.
When you track the right metrics, build attribution into your workflows, and use dashboards to surface what’s actually driving conversions, your automations become powerful and measurable rather than background noise.
By investing in thoughtful reporting now, you give your team the clarity to optimize confidently, the credibility to demonstrate ROI, and the insight to scale what works.
If you haven’t audited your automations in a while, now is the perfect time to start.


.avif)


%25201.avif)


.avif)


.svg)
