


Customer churn is one of the clearest signals that something in your customer experience, product, or pricing isn’t working as it should.
But it’s also one of the most valuable sources of insight if you know how to analyze it.
Churn analysis is the systematic process of studying why customers leave, when it happens, and what patterns predict it.
By combining quantitative data (like engagement metrics and revenue loss) with qualitative feedback (like exit surveys and interviews), teams can uncover the real reasons behind attrition and act before it compounds.
In this guide, we’ll break down how to:
- Define and measure churn effectively
- Recognize the leading signals that predict customer loss
- Identify common root causes and risk factors
- Apply practical recovery and win-back strategies
- Use the right tools and models to make churn analysis scalable
The goal is to help product, growth, and marketing teams turn churn from a passive KPI into a powerful customer retention strategy that strengthens loyalty, boosts lifetime value, and drives sustainable growth.
What Is Churn Analysis?
Churn analysis is the process of using data to understand why customers stop using your product or service.
It goes beyond simply tracking who leaves. It's about uncovering the behavioral, experiential, and contextual factors that drive those decisions.
Churn analysis helps businesses identify churn patterns so they can act before it’s too late. By examining customer activity, engagement, sentiment, and lifecycle data, teams can detect early warning signs, diagnose the root causes, and implement interventions that reduce churn and increase retention.
Churn-Related Definitions
There are a few related concepts worth clarifying before we dive in:
Churn Rate vs. Retention Rate
Churn rate measures the percentage of customers who leave during a given period, while retention rate measures the opposite: those who stay.
Together, they give a full picture of customer loyalty and stability.
Voluntary vs. Involuntary Churn
Voluntary churn happens when customers intentionally cancel or stop using a product, often due to dissatisfaction or a better alternative.
Involuntary churn results from payment failures, expired cards, or account issues; situations where the customer didn’t necessarily choose to leave.
Customer Churn vs. Revenue Churn
Customer churn tracks the number of customers lost, whereas revenue churn measures the dollar value lost from those customers.
A business might lose fewer customers overall but still face high revenue churn if those who leave are high-value accounts.
In practice, effective churn analysis blends all these perspectives to reveal what’s really driving attrition and where the biggest opportunities for improvement lie.
Why Churn Analysis Matters
Customer churn is a direct hit to a company’s growth engine. Every customer who leaves takes their recurring revenue, advocacy, and future upsell potential with them.
Churn analysis is critical so you can:
Check Lost Revenue and Slower Growth
When churn goes unchecked, acquisition efforts simply fill a leaking bucket.
A high churn rate can offset even the strongest acquisition performance, forcing teams to spend more just to maintain the same topline.
Stop Erosion of Customer Lifetime Value (CLV)
CLV depends on how long customers stay and how much they spend over time.
Even modest improvements in customer retention can have an outsized effect; research by Bain & Company shows that even a 5% increase in retention can lift profits by 25–95%.
Glean Product and Service Insights
Churn data is a mirror reflecting where your product, experience, or messaging falls short.
By analyzing churn reasons and feedback trends, teams can uncover specific issues, from confusing onboarding flows to missing features or misaligned pricing.
Shift From Reactive Fixes to Proactive Retention
Instead of scrambling to win customers back after they leave, churn analysis enables early detection.
By tracking engagement signals and customer health scores, companies can intervene before users disengage, turning churn prevention into an ongoing growth strategy.
In short, churn analysis transforms attrition from a silent loss into an active source of insight; a continuous feedback loop that strengthens product-market fit, boosts retention, and compounds growth over time.
Recognizing Churn (Signals & Metrics)
Before you can reduce churn, you need to recognize what it looks like and where it’s happening.
If you’re wondering how to analyze churn, it starts with tracking when customers leave and how their behavior changes in the time leading up to it. The right metrics reveal both the scale of attrition and the early signals that predict it.
Here are the key signals and metrics to tune into:
Churn Rate and Revenue Churn
At the simplest level, your churn rate measures the percentage of customers who stop using your product during a specific time period.
Revenue churn goes deeper, showing the value of the revenue lost: a critical distinction for subscription or tiered-pricing models where losing one large customer can outweigh ten smaller ones.
Cohort Analysis
Looking at churn by cohort (grouping users by signup month, plan type, or campaign source) helps identify patterns that aggregate metrics might hide.
For example, customers acquired through one marketing channel may have a much higher drop-off rate after three months, signaling an onboarding or expectation gap.
A 10% churn rate could be hiding a 2% churn among enterprise clients and a 25% churn among new SMB signups; two very different challenges that require different strategies.
Leading Indicators of Churn
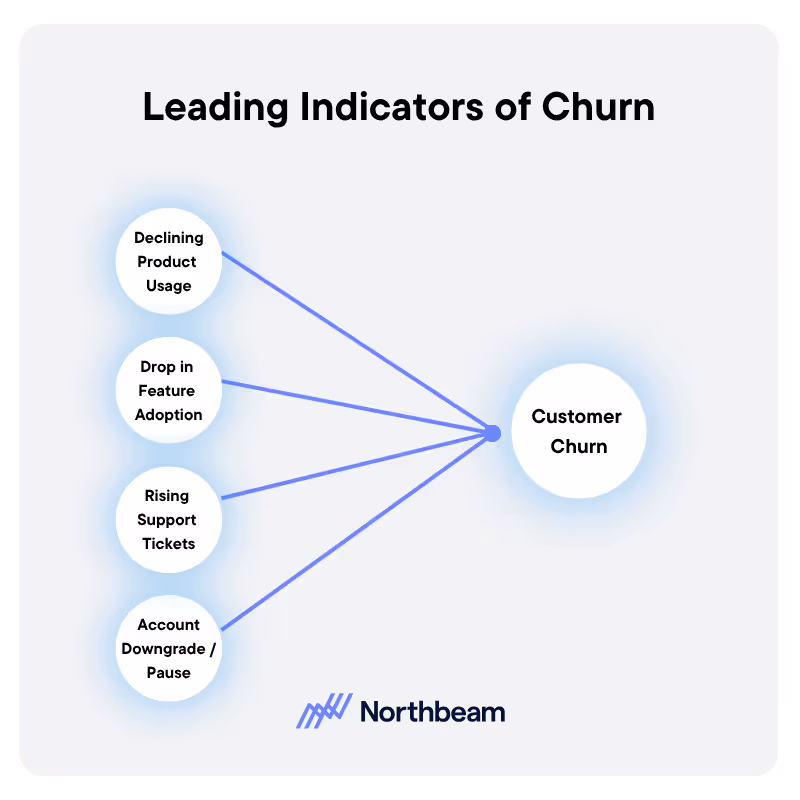
The most valuable churn signals appear before customers actually cancel.
For example, if you’re building churn prevention strategies for SaaS / subscription, watch for:
- Declining product usage or engagement
- Drop in feature adoption or login frequency
- Rising support tickets or unresolved issues
- Account downgrades, paused subscriptions, or missed payments
Tracking these trends helps you intervene while customers are still recoverable.
Customer Health Scores
A composite customer health score combines behavioral, transactional, and sentiment data, such as activity levels, feedback scores, and NPS ratings, to create an at-a-glance view of customer stability.
When a score dips below a certain threshold, it can trigger proactive outreach from your customer success or support teams.
Exit Feedback and Cancellation Data
When a customer leaves, their reason for doing so is invaluable. Use exit surveys or short cancellation forms to capture why they’re leaving, whether its price, missing features, product complexity, or something else.
Over time, this qualitative data helps validate what your metrics can only imply.
Together, these signals create a multidimensional picture of churn, including why customers churn and how to recover them.
Root Causes & Risk Factors of Churn
Churn is rarely random. Beneath every cancellation is a story about unmet expectations, friction, or shifting needs.
Identifying the underlying causes is the difference between reacting to churn and preventing it altogether.
Key causes of churn include:
Poor Product-Market Fit Or Mismatched Expectations
When customers realize the product doesn’t solve their specific problem, or that it promised more than it delivered, churn is inevitable. This often traces back to mismatched messaging during acquisition or an unclear value proposition.
UX Or Performance Issues
Slow load times, buggy releases, or confusing navigation create daily frustration that compounds over time. Even small usability issues can add up, especially when alternatives make switching easy.
Weak Onboarding Or Adoption Support
The first few days or weeks determine whether customers experience value early on. If onboarding is complex, impersonal, or unclear, users may never reach the “aha moment” that makes them stay.
Lack Of Ongoing Engagement Or Value Delivery
Even customers who start strong can drift away if they stop seeing consistent value. When communication drops off, features go unused, or updates fail to excite, engagement naturally declines.
Pricing Misalignment Or Perceived Value Gap
Customers compare what they’re paying to what they’re getting. If competitors offer a similar solution for less, or if the perceived ROI doesn’t justify the cost, price becomes a reason to leave, even if it’s not the real root cause.
Competitive Alternatives Or Product Comparison
A strong product today can still lose customers tomorrow if competitors innovate faster. Churn spikes often follow major market shifts, new features elsewhere, or changing user expectations.
Involuntary Churn
Not all churn is intentional. Payment failures, expired cards, and billing errors can quietly erode retention. These “silent” losses are often easy to fix with better dunning logic, reminder emails, or automated payment recovery.
Seasonal Or External Behavior
Some churn patterns are tied to seasonality or broader market conditions. Retail and travel businesses, for instance, often see predictable dips during off-seasons or economic downturns.
By isolating these drivers, teams can prioritize fixes based on what’s actionable, strengthening product-market fit, improving experiences, and reducing friction points before customers decide to leave.
Churn Recovery & Win-Back Strategies
Even with the best customer retention programs, some churn is inevitable. The key is to treat every lost customer as a potential return, and to design systems that make recovery both scalable and personal.
Effective win-back strategies not only re-engage past customers but also prevent the same issues from recurring.
A strong win-back program includes:
Exit Surveys And Feedback Loops
Every churn event is a chance to learn. Collect exit feedback through short surveys or cancellation flows that ask why customers are leaving.
Segment the responses by reason (pricing, product limitations, service quality, or other themes) to uncover patterns. Aggregating these insights provides a direct map of what to fix first.
Targeted Win-Back Campaigns
Not all customers respond to the same message. Build targeted campaigns that speak directly to the reason for churn: a feature release for users who cited missing functionality, a discount or extended trial for those who found it too expensive, or content highlighting recent improvements.
Personalized “come back” messages show customers that their feedback led to change.
Personalized Outreach And Reactivation Sequences
Beyond automated campaigns, direct contact can make a difference. Combine email, in-app prompts, support calls, and personalized incentives to remind customers of your product’s value.
The most effective reactivation sequences feel human and timely, not generic or pushy.
Flexible Re-Onboarding Paths
When customers return, they shouldn’t have to start from scratch. Offer a smooth, tailored re-onboarding process that acknowledges their prior experience and highlights what’s new or improved since they left.
This reduces friction and helps them quickly rediscover value.
Payment Recovery And Dunning Strategies
For involuntary churn, automation is your ally. Implement retry logic, card update reminders, and grace periods to recover failed payments before accounts lapse.
Well-designed dunning workflows can quietly save a surprising percentage of customers without requiring direct outreach.
Product Improvements And Feature Fixes
Feedback from churned customers is one of the most actionable sources of insight. Use it to prioritize product enhancements, close feature gaps, and eliminate known pain points.
When you resolve the issues that drove people away, win-back campaigns become far more effective.
Segmentation And Differentiated Retention Treatment
Not all customers are equally valuable or equally at risk. Segment your audience by lifetime value, engagement level, or tenure, and apply different levels of intervention.
High-value accounts may warrant one-to-one outreach, while lighter-touch email automations work for lower-value segments.
Predictive Churn Modeling And Early Interventions
The most powerful win-back strategy is prevention.
Use churn prediction models to forecast which customers are likely to leave based on behavioral and transactional data. Then trigger proactive retention campaigns (product nudges, support check-ins, or loyalty rewards) before churn happens.
Together, these tactics turn churn into a continuous learning loop: diagnose, improve, re-engage, and retain.
Tools & Methods for Churn Analysis
Successful churn analysis relies on the right combination of tools, data, and analytical approaches.
It’s not just about tracking who left, it’s about connecting signals across platforms to reveal why they left and what to do next.
Analytics Platforms
Tools like Amplitude, Pendo, and Tableau help teams visualize behavioral data, track engagement trends, and monitor how customer actions correlate with retention.
These platforms are essential for identifying the early warning signs of churn, such as reduced feature usage or declining session frequency.
Subscription Analytics Tools And Dashboards
For subscription-based or SaaS businesses, tools like Baremetrics and ChartMogul provide specialized dashboards for metrics like monthly recurring revenue (MRR), churn rate, and lifetime value (LTV).
These insights allow you to quantify churn’s financial impact and track improvements over time.
Machine Learning And Statistical Modeling
Predictive churn models use techniques such as logistic regression, random forest, and ensemble learning to forecast which customers are most likely to churn.
By training on historical data, these models identify patterns that human analysts might miss, enabling proactive interventions before cancellations occur.
Feature Engineering
Behind every predictive model lies smart feature engineering, deriving metrics like usage frequency, time since last activity, or support interaction counts.
These variables translate raw data into meaningful indicators of customer health and churn risk.
Cohort And Retention Analysis
Cohort tables and survival analysis reveal how long different customer segments remain active.
Tracking retention curves helps teams see where drop-offs occur and whether recent initiatives (like onboarding improvements or pricing updates) are having a measurable impact.
Cancellation Surveys And Qualitative Feedback
While quantitative data shows what is happening, qualitative insights explain why.
Exit surveys, user interviews, and customer feedback channels reveal the human reasons behind churn, turning raw metrics into actionable strategy.
A/B Testing Of Retention And Win-Back Techniques
Run controlled experiments to measure which retention tactics work best, whether it’s a new reactivation email, a feature release notification, or an incentive offer.
Continuous testing helps refine your churn prevention and win-back playbooks.
Regular Audits And Dashboards With Alerting
Establish ongoing churn monitoring with real-time dashboards and automated alerts.
By flagging sudden spikes or unusual churn patterns early, teams can investigate root causes and act before small issues scale into major losses.
Together, these tools and methods turn churn analysis into a living system that continuously learns, predicts, and optimizes retention outcomes over time.
Churn Analysis Example: eCommerce Case Study
To see churn analysis in practice, consider a hypothetical e-commerce brand called Glow that sells subscription-based beauty boxes.
Despite steady new signups, Glow noticed revenue plateauing and suspected a churn problem.
Using churn analysis, the team uncovered a clear pattern: while overall churn averaged 12% per month, a deeper segmentation analysis revealed one hidden, high-churn cohort: first-time subscribers acquired through social media ads.
This group was churning at nearly 30%, twice the company average.
When Glow dug deeper into behavioral data, several red flags emerged for this cohort:
- Lower engagement with post-purchase emails and community content
- High rates of unopened boxes and skipped shipments
- Frequent “product didn’t match expectations” feedback in exit surveys
Armed with these insights, the team took a multi-pronged approach:
- Targeted win-back campaigns: They launched personalized “We Miss You” emails featuring a sneak peek of next month’s box and a 15% discount for returning customers.
- Flexible re-onboarding: Returning users were invited to retake the beauty quiz to refresh their preferences, ensuring the next box felt customized and new.
- Product improvements: The company expanded its quiz logic and supplier pool to better match items with customer profiles.
- Predictive modeling: Using usage and engagement data, Glow built a churn prediction model that flagged high-risk subscribers after their first shipment, triggering proactive check-ins.
Within three months, Glow saw measurable results:
- Churn dropped by 29% in the target segment
- Revenue per subscriber increased due to longer retention
- Exit survey mentions of “poor fit” decreased by 40%
By pairing segmentation analysis with tailored recovery strategies, Glow transformed churn from a hidden leak into a source of actionable insight and built a system that keeps customers engaged long after their first purchase.
Churn Analysis Best Practices Checklist
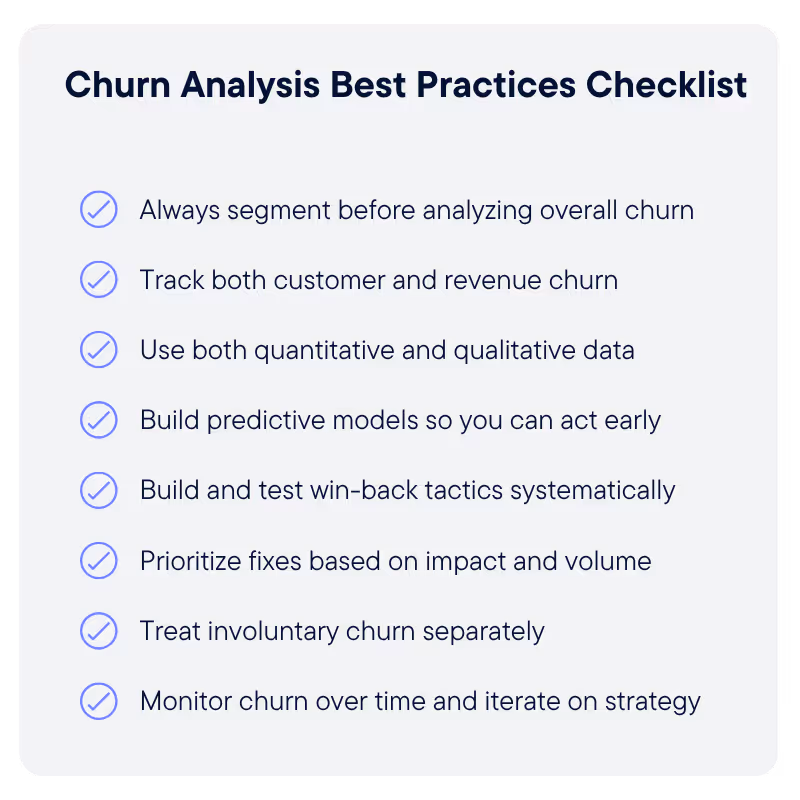
These eight best practices ensure your churn analysis insights stay sharp and your retention strategies keep evolving.
1. Always Segment Before Analyzing Overall Churn
Aggregate churn rates can hide important differences between customer groups. Break data down by plan type, acquisition source, region, or tenure to reveal where attrition truly happens.
2. Track Both Customer And Revenue Churn
Losing one enterprise client can outweigh dozens of small accounts. Measuring both customer count and revenue impact helps you focus on the churn that matters most.
3. Use A Combination Of Quantitative And Qualitative Data
Metrics show what’s happening, but feedback explains why. Pair product analytics with surveys, interviews, and support transcripts to see the full picture.
4. Build Predictive Models To Act Early
Don’t wait for churn to happen. Use machine learning or behavioral scoring to flag customers showing early signs of disengagement and trigger targeted retention actions.
5. Test Win-Back Tactics Systematically
Treat reactivation like an experiment. A/B test subject lines, offers, and messaging to discover which tactics yield the highest recovery rates.
6. Prioritize Fixes Based On Impact And Volume
Not every churn driver deserves equal attention. Rank causes by how many customers they affect and how easily they can be resolved, focusing first on high-volume, high-impact issues.
7. Treat Involuntary Churn Separately
Payment failures and account issues are operational, not emotional. Use automated billing retries and clear communication to recover these customers efficiently.
8. Monitor Churn Over Time And Iterate
Retention strategies aren’t one-and-done. Track trends quarterly, measure progress against baselines, and refine your approach as products, markets, and customer expectations evolve.
When followed consistently, these principles turn churn analysis from a reactive report into a continuous engine for retention and growth.
Turn Churn Into Opportunity
Churn is an unavoidable part of doing business, but how you respond to it determines whether it stays a revenue leak or becomes a growth lever.
With the right data, tools, and processes, churn analysis transforms from a backward-looking metric into a forward-looking advantage.
Every lost customer offers insight into how to build a better product, experience, and relationship. By identifying early warning signals, understanding root causes, and applying targeted win-back strategies, teams can not only reduce churn but also strengthen customer loyalty and lifetime value.
Next steps:
- Audit your churn metrics: Track both customer and revenue churn?
- Build an exit feedback loop: Capture reasons for departure and aggregate them by cause.
- Pilot one win-back campaign: Target a single churn segment and measure your recovery rate.
With thoughtful analysis and proactive retention, every departure becomes a chance to learn, adapt, and grow stronger.


.avif)


%25201.avif)


.avif)


.svg)
