Blog

Is Your Company Data-Mature? Understanding Data Maturity Models for Marketing

Is Your Team Really “Data Driven?”
Is Your Company Data Mature Understanding Data Maturity Models For Marketing

TL;DR

  • Track engagement, conversion, revenue, attribution, and efficiency metrics to understand true performance.
  • Build a reporting framework that maps touchpoints, automates data flows, and visualizes drop-offs and ROI.
  • Use attribution modeling to connect drip activity to downstream actions.
  • Optimize continuously based on data, not assumptions, and communicate results clearly to stakeholders.

Many marketing teams talk about being “data-driven,” but data maturity is a spectrum. 

Some teams rely on basic reports pulled at the end of the month. Others operate with real-time insights, automated decisioning, and predictive models shaping strategy. 

Understanding where your team falls on that spectrum, and how to move forward, is the core purpose of a marketing data maturity model.

In this guide, we’ll break down what “data maturity” means, the key dimensions that shape it, and the five stages most teams move through when moving from an ad-hoc to a data-mature marketing organization.

What “Data Maturity” Means for Marketing

In a marketing context, data maturity reflects how effectively your team uses data to guide strategy, personalize outreach, optimize campaigns, and tie activity to measurable business outcomes. 

Mature organizations don’t treat data as a reporting function. They use it as the connective tissue of their entire growth engine, from segmentation and creative testing to budgeting and lifecycle strategy.

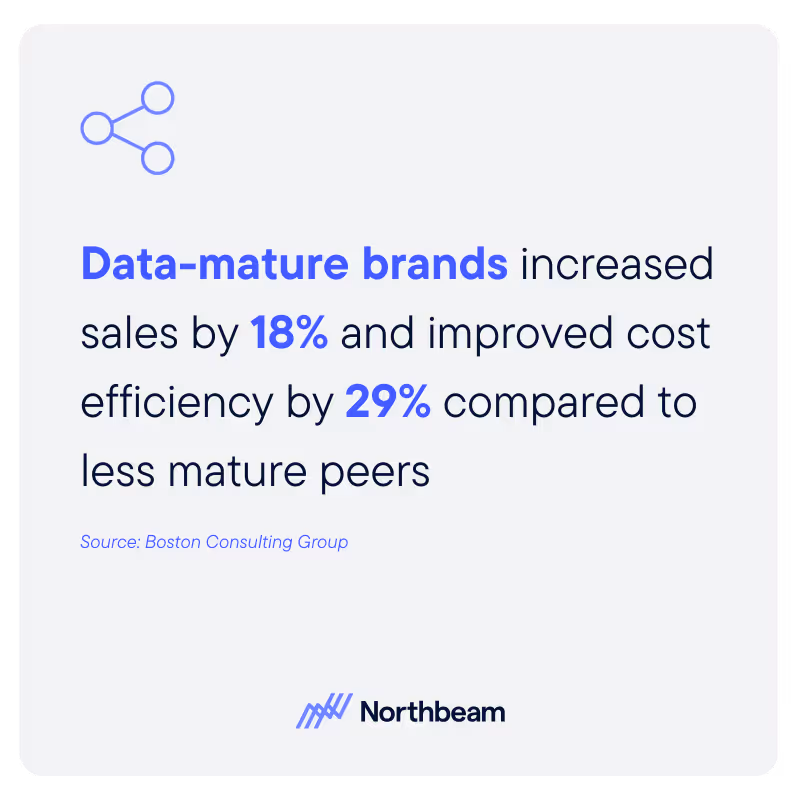
The impact is tangible. Research from Boston Consulting Group (BCG) found that more digitally mature brands increased sales by 18% and improved cost efficiency by 29% compared to less mature peers. 

In other words, data maturity is one of the clearest competitive advantages a marketing team can build.

Most teams can also recognize the early warning signs that they aren’t as data-mature as they’d like to be:

  • Data lives in disconnected tools and channels
  • Dashboards are isolated, inconsistent, or manually maintained
  • Reporting depends on spreadsheets and heroic effort rather than repeatable systems
  • Campaigns rely on gut instinct because insights are incomplete or hard to access
  • Instead of measuring the full customer journey, teams focus only on surface-level metrics like clicks or impressions.

These patterns aren’t failures. They’re indicators of where you are today, and a starting point for building a more integrated, data-mature marketing organization.

Key Dimensions of a Data Maturity Model for Marketing Teams

To understand your level of data maturity, it helps to break the concept into core dimensions:

Strategy & Alignment

Data maturity starts with strategy and alignment. This means marketing KPIs are explicitly tied to business objectives, not created in isolation. 

Mature teams work within a culture where data-informed decision-making is expected, shared, and reinforced, from leadership priorities to campaign planning. 

Without this alignment, even the most sophisticated tools fail to drive meaningful outcomes.

Data Governance & Quality

Governance covers how your data is collected, cleaned, standardized, and maintained. High-maturity teams invest in master data management, ensure data accuracy and accessibility, and define processes that keep customer data trustworthy over time.

Data & Technology Architecture

Your marketing tech stack is only as powerful as the connections between its components. 

Modern architecture enables cross-channel data flow, unifies event and customer data, and supports real-time analytics. 

If tools operate in silos or require heavy manual intervention, insights will lag and opportunities will be missed.

Analytics Capability

Analytics maturity evolves in stages: 

  • Descriptive (what happened)
  • Diagnostic (why it happened)
  • Predictive (what will happen)
  • Prescriptive (what to do next)

As teams progress, data becomes less about reporting and more about foresight. Mature organizations incorporate modeling, forecasting, and experimentation into everyday workflows.

People & Culture

Technology can only take an organization so far. Data-mature teams cultivate literacy across their marketing organization and beyond, encouraging experimentation, and promoting tight collaboration among marketing, analytics, product, and engineering. 

On these types of teams, curiosity and cross-functional problem-solving become cultural norms.

Execution & Activation

Ultimately, maturity shows up in how well data fuels daily marketing activity. 

This includes smarter segmentation, personalization at scale, rigorous measurement, consistent optimization, and campaigns that adapt in real time. 

The most mature teams close the loop between insight and action quickly and repeatedly.

These six dimensions form the framework for assessing your current state and identifying where maturity improvements will have the highest impact.

Typical Stages of Marketing Data Maturity

Every marketing team sits somewhere on the data-maturity spectrum. Understanding your stage helps you benchmark your current capabilities and set realistic expectations for growth. 

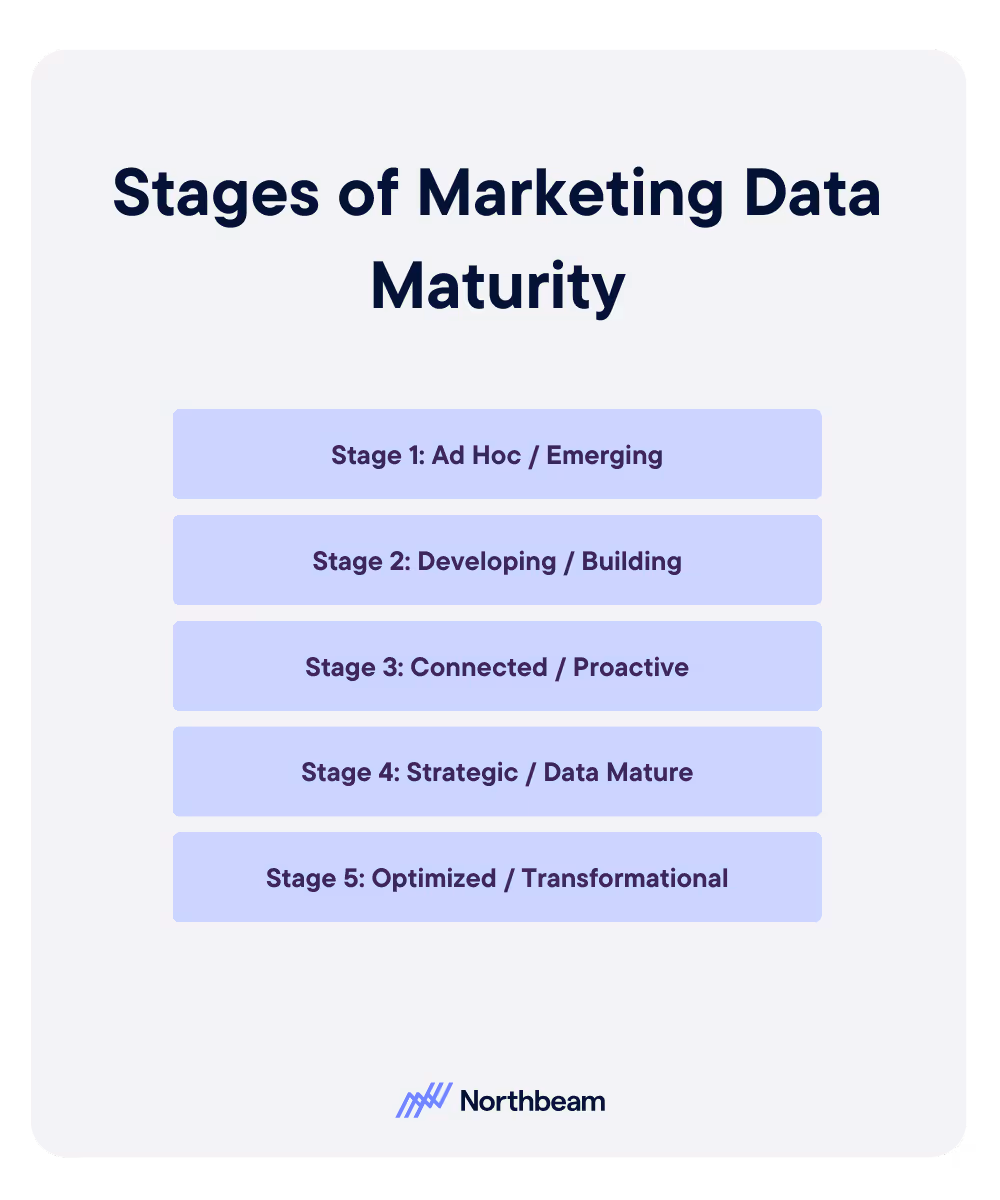
Most organizations fall into one of five broad categories:

Stage 1: Ad Hoc / Emerging

Teams at this stage rely on basic campaign metrics like impressions and clicks. 

Data lives in channel-specific tools, reporting is inconsistent, and insights rarely influence strategy. 

Most decision-making happens through intuition or past experience, making this the least scalable stage.

Stage 2: Developing / Building

Some unification begins to take shape in Stage 2. Teams might connect a few data sources or build early cross-channel dashboards. 

Segmentation and personalization are possible but limited, often requiring manual effort. This is the stage where teams recognize the value of data but haven’t yet operationalized it.

Stage 3: Connected / Proactive

Data infrastructure becomes more robust and reliable in Stage 3. A shared customer view emerges, analytics begin driving decisions, and campaigns are optimized across channels rather than within silos. 

Teams at this stage shift from reactive reporting to proactive insight generation.

Stage 4: Strategic / Data-Mature

In Stage 4, marketing becomes deeply integrated with predictive analytics, real-time optimization, and full-funnel measurement aligned to business outcomes. 

Testing is systematic, insights flow quickly into activation, and data literacy is strong across the organization. This is where real competitive advantage becomes visible.

Stage 5: Optimized / Transformational

In Stage 5, marketing operates as a serious growth engine. AI, automation, and advanced modeling shape strategy at scale. Data is embedded into culture, not just tooling. Teams move with agility, adapting to customer behavior in real time and continuously learning from every interaction.

By identifying your stage, you can build a roadmap that’s ambitious but achievable. But how do you know exactly what stage you’re in now? 

How to Assess Marketing Data Maturity

To assess your team’s data maturity, start by conducting a data-driven marketing maturity audit. 

This involves scoring your team across each key dimension listed above: 

  • Strategy and alignment
  • Data governance and quality
  • Data and tech architecture
  • Marketing analytics maturity
  • People and culture
  • Execution and activation

Give yourself a score for each dimension. The goal isn’t to produce a perfect number, it’s to reveal patterns and help you decide where to focus first. 

Many teams pair this internal audit with external benchmarking. Frameworks from Gartner and other industry leaders offer structured questionnaires and maturity rubrics that help you calibrate your results against peers and best-in-class organizations. 

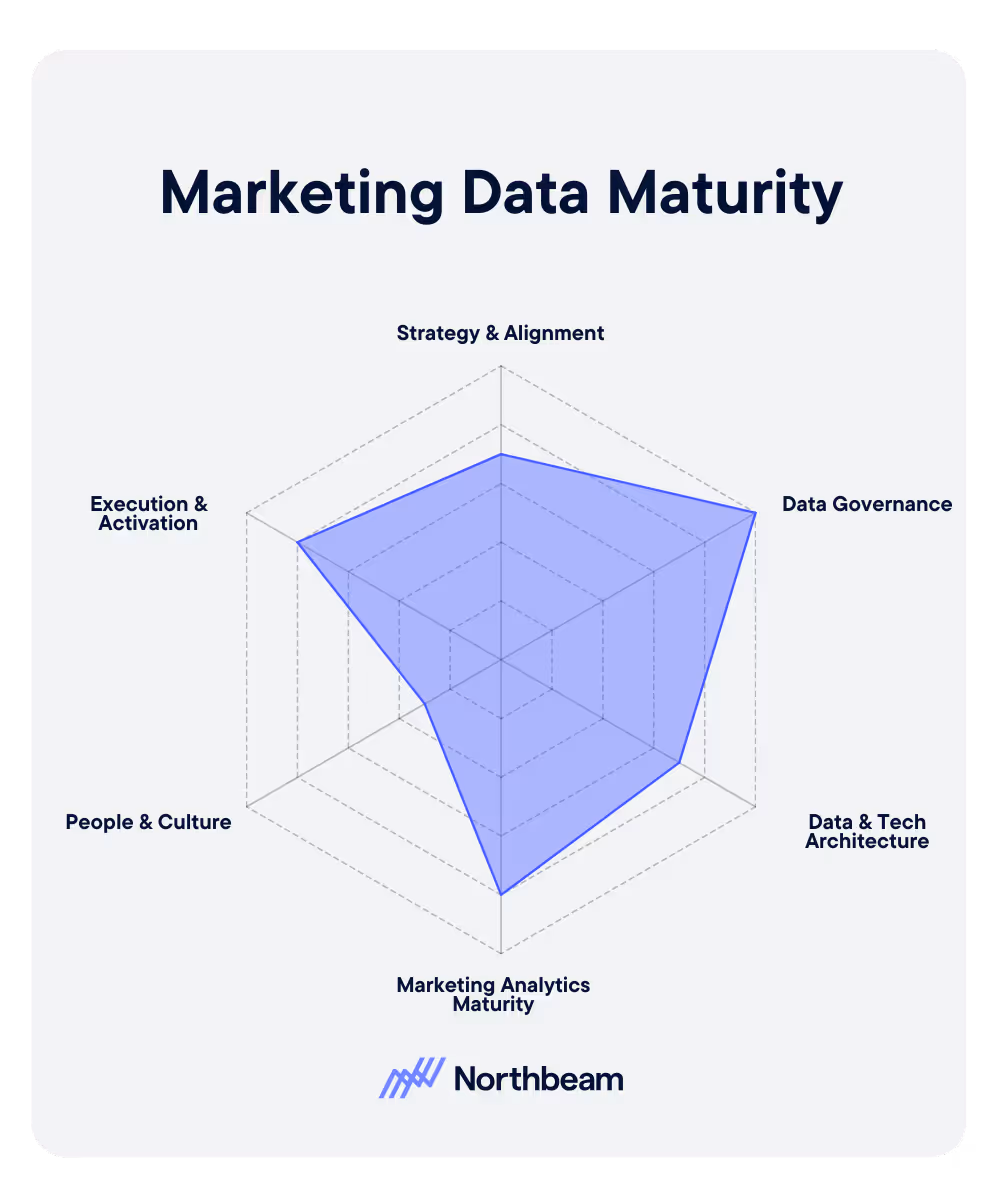
To bring your assessment to life, visualize your scores. A radar chart or similar diagnostic view makes maturity gaps immediately visible and highlights where investment will drive the biggest lift. 

Often, you’ll see that one or two lagging dimensions disproportionately drag down your overall maturity level.

Most importantly, conduct the assessment collaboratively. Involving stakeholders from marketing, analytics, IT, data engineering, and even leadership ensures you’re capturing the full picture. 

It also creates early buy-in for the roadmap you’ll build next, because maturity transformation is rarely a marketing-only project. It succeeds when the entire organization is aligned around the same goals, the same metrics, and the same definition of “data-driven.”

Building the Roadmap to Data-Mature Marketing

An assessment becomes meaningful once it turns into action. 

After identifying your strengths and gaps, the next step is to build a phased roadmap that moves your organization toward greater data maturity in a realistic, sustainable way. 

Start with Quick Wins

These are low-effort, high-impact improvements that unlock immediate value. 

Examples include:

  • Unifying a few high-value data sources
  • Standardizing naming conventions or taxonomies
  • Building or refreshing core dashboards
  • Implementing basic segmentation or journey mapping
  • Eliminating manual reporting bottlenecks

Move to Medium-Term Initiatives

These require more coordination and investment, but fundamentally upgrade your marketing operations. 

Common examples:

  • Expanding or modernizing your marketing tech stack
  • Implementing a customer data platform (CDP)
  • Enabling real-time analytics pipelines or event tracking
  • Formalizing experimentation processes
  • Upskilling teams and reinforcing a data-driven culture
  • Improving collaboration between marketing, analytics, and engineering

Plan for the Long-Term

These initiatives help you reach full data maturity and create a scalable, self-optimizing marketing engine. 

They often include:

  • Predictive modeling and forecasting
  • Advanced attribution and measurement
  • Automated decision-making
  • Personalization at scale across channels
  • AI-driven optimization

Tie Initiatives to Business Outcomes

Align your roadmap with measurable company goals such as:

  • Lower customer acquisition cost (CAC)
  • Improved retention or customer lifetime value (LTV)
  • Faster experimentation cycles
  • Increased marketing-influenced revenue

Establish Governance and Operating Models

To ensure maturity isn’t a one-off project, define:

  • Data ownership and stewardship
  • Processes, documentation, and QA standards
  • Recurring maturity audits and alignment rituals

Measure Maturity Improvements Over Time

Track indicators like:

  • Percentage of campaigns using data-driven segmentation
  • Time from insight to action
  • Cost per test or experiment
  • Percentage of decisions backed by data

Challenges & Considerations for Marketing Leaders

Even with a clear roadmap, progressing through the stages of data maturity isn’t always straightforward.

Most teams encounter predictable obstacles that can slow down momentum or create false signals of progress. Being aware of these challenges upfront helps leaders navigate them with more intention and fewer surprises.

Data Silos

When channels, tools, or business units operate in isolation, insights stay fragmented and teams lose the ability to understand the full customer journey.

Resource Constraints

Many organizations underestimate the talent required to operationalize data maturity. It’s not just the tools, it’s analysts, engineers, and marketers who can translate data into meaningful action.

Tech Before Culture

A shiny new tool can’t compensate for misaligned processes or a culture that doesn’t value experimentation and data-driven decision-making. Culture and operations must mature alongside the stack.

Misaligned Expectations

Moving from Stage 1 to Stage 4 isn’t a quick win. It requires sustained investment, organizational alignment, and a willingness to change how decisions are made.

Privacy & Ethical Considerations

As personalization becomes more sophisticated, compliance, consent, and responsible data use become non-negotiable components of maturity.

“Maturity Theater”

It’s easy to claim advanced capabilities without the underlying systems to support them. True data maturity is demonstrated through measurable impact, not labels.

With these challenges in mind, leaders can approach maturity work with clearer expectations and a more grounded path forward.

Case Study: How One eCommerce Brand Leveled Up Its Data Maturity

Consider a mid-size ecommerce brand operating squarely at Stage 2 of data maturity. 

Their marketing efforts were spread across disconnected tools, each channel measured in isolation. Without a unified customer view, the team relied on surface-level metrics like clicks, opens, and last-touch attribution.

Their campaigns performed reasonably well, but growth had stalled; they couldn’t see what was working across the full customer journey.

To move forward, the team implemented a customer data platform (CDP) and consolidated cross-channel tracking. 

They defined a shared set of KPIs, aligned stakeholders around a unified measurement framework, and rebuilt core dashboards to reflect customer-level behavior rather than channel-level outputs.

Within a quarter, the shift was clear. 

Reporting evolved from “clicks only” to dark-funnel attribution and multi-touch insights. Campaigns moved from one-off initiatives to journey-based optimization, and tests scaled faster because the team could finally see which touchpoints drove incremental value.

These improvements lifted ROI, shortened the time from insight to action, and moved the organization firmly into Stage 3: Connected and Proactive. 

Start Your Maturity Journey Today

Reaching higher levels of data maturity doesn’t require a massive transformation from day one. Small, structured steps can create meaningful momentum and help your team build confidence along the way.

Here is a quick checklist to help you get started:

  • Host an internal workshop with stakeholders from marketing, analytics, IT, and data engineering. Use the maturity dimensions outlined in this guide to score your current state and surface gaps or inconsistencies.
  • Identify three priority initiatives: one quick win, one medium-term improvement, and one long-term capability. Assign clear owners, timelines, and success metrics so each initiative has a path to execution.
  • Build a maturity dashboard to track your progress. Useful indicators like the percentage of campaigns using insights, time from insight to activation, or the share of marketing spend influenced by data.
  • Establish a quarterly review cadence to revisit your maturity score and evolve your roadmap. 

Marketing data maturity isn’t static. It’s a continual process of strengthening foundations, refining processes, and expanding capabilities.

Every step forward compounds, and the brands that invest steadily unlock a clear advantage.

Continue Reading

Introducing Incrementality By Northbeam: Automated Lift Testing You Can Trust

Introducing Incrementality by Northbeam: Automated Lift Testing You Can Trust

Run incrementality tests end-to-end inside Northbeam—automated design, rigorous validation, and unified results alongside your MTA and MMM for confident, daily decision-making.
Reporting on Marketing Automation Performance: Proving the ROI of Your Drip Campaigns

Reporting on Marketing Automation Performance: Proving the ROI of Your Drip Campaigns

Measure, Attribute, and Prove Business Value
Marketing Funnel Automation Scaling Engagement On Autopilot

Marketing Funnel Automation: Scaling Engagement on Autopilot

Build, Automate, and Measure
Why New Customer ROAS Matters More Than Blended Metrics

Why New Customer ROAS Matters More Than Blended Metrics

Why optimizing to New Customer ROAS (nROAS) — not blended ROAS — is the only way to scale net‑new growth, with a simple daily workflow to make it operational.
Channel Strategy How To Choose The Right Marketing Channels For Your Business

Channel Strategy: How to Choose the Right Marketing Channels for Your Business

Evaluate, Test, and Optimize Your Marketing Channels
Ad Fatigue In Digital Marketing How To Recognize And Remedy It

Ad Fatigue in Digital Marketing: How to Recognize & Remedy It

How to Know When Your Audience Has Seen Enough
Churn Analysis Identifying Why Customers Leave And How To Win Them Back

Churn Analysis: Identifying Why Customers Leave (And How to Win Them Back)

Uncover Churn Drivers and Build Stronger Retention Strategies
Funnel Creation Made Simple How To Map Out Your Marketing Funnel

Funnel Creation Made Simple: How to Map Out Your Marketing Funnel

Map, Measure, and Optimize the Customer Journey
Kill Last Click Bias A Simple Playbook For Read During BFCM

Kill Last‑Click Bias: A Simple Playbook for Reads During BFCM

A practical, windowed-read playbook—short for capture, longer for prospecting—to avoid last‑click bias during Cyber Five.
The Cyber Five Pattern What To Expect Heading Into BFCM

The Cyber Five Pattern: What to expect Heading Into BFCM

Planning Cyber Five with pattern‑based pacing and clear measurement reads.
What Is MAU Tracking Monthly Active Users To Gauge Growth

What Is MAU? Tracking Monthly Active Users to Gauge Growth

Learn what Monthly Active Users (MAU) means, how to measure it accurately, and how to use MAU trends to improve product engagement, retention, and growth.
User Segmentation Strategies How To Personalize Marketing For Every Audience

User Segmentation Strategies: How to Personalize Marketing for Every Audience

Learn how to build and activate user segments that power personalized marketing, boost engagement, and drive long-term customer loyalty.
Which Campaigns Benefit Most From CDV

Which Campaigns Benefit Most from C+DV? Prospecting, Reach/Traffic, and Retention by the Numbers

Learning How C+DV Evens the Playing Field
Fogg Behavior Model: Motivation, Ability, and Prompts

Fogg Behavior Model: Motivation, Ability, and Prompts

Apply Behavior Design Principles to Your Marketing Strategy
Lifecycle Marketing 101 For Every Stage Of The Customer Journey

Lifecycle Marketing 101: Engaging Customers at Every Stage of the Journey

Build Customer Relationships That Last

Benchmarks & Stoplights: Turning Data Into Daily Decisions for Ad Optimization

Turn your best performance days into a live decision system with clear green, yellow, and red signals—so your team knows exactly when to scale, pause, or pivot.
Behavioral Data In Marketing How User Behavior Drives Growth

Behavioral Data In Marketing: How User Behavior Drives Growth

Optimize journeys and personalize experiences
Cohort Analysis For Marketers Uncovering Trends In Customer Behavior

Cohort Analysis for Marketers: Uncovering Trends In Customer Behavior

Learn how to use cohort analysis to track retention, forecast LTV, and drive sustainable growth.
User Stickiness How To Measure Customer Engagement Metric

User Stickiness: The Metric to Measure Customer Engagement (and How to Improve It)

Discover how to calculate and improve user stickiness (DAU/MAU) — the key metric for measuring customer engagement and loyalty.

The PESO Model: Integrating Paid, Earned, Shared, and Owned Media

Learn how the PESO model unifies Paid, Earned, Shared, and Owned media into one powerful strategy.
reasons your awarness campaigns arent driving revenue

7 Reasons Your Awareness Campaigns Aren’t Driving Revenue

How evolving attribution models, creative strategy, and platform dynamics are redefining top-of-funnel success this BFCM season.

How Omnilux Drove a 659% ROAS Lift on Pinterest with Northbeam’s Clicks + Deterministic Views

A case study with Northbeam's newest attribution model.
Clicks + Deterministic Views, by Northbeam.

Introducing Clicks + Deterministic Views by Northbeam

A revolutionary new viewthrough model, now available in Northbeam.

Contextual Targeting In Advertising: Reaching Audiences Without Cookies

Discover how contextual targeting delivers privacy-first, high-performing ads without cookies.

First vs Second vs Third-Party Data: What Are They and Why They Matter

Learn the differences between first-, second-, and third-party data.

Zero-Party Data: The New Gold Standard in Privacy-First Marketing

Learn best practices for collection, activation, and governance to drive trust and ROI.
The Explore Exploit Cycle Of Meta's Algorithm

The Explore–Exploit Cycle of Meta’s Algorithm

Why Meta’s algorithm makes performance swing — and how to ride the cycle instead of panicking through the dips.
what-is-gclid-complete-guide-to-google-click-identifier

What Is GCLID? Complete Guide to Google Click Identifier

Learn what GCLID is, how it works, and why it’s essential for accurate Google Ads tracking.
beyond roas fundamentals of advertising hero

Beyond ROAS: Fundamentals of Advertising In 2025

Why relying on ROAS alone can stunt growth—and the metrics that reveal if your ads are truly building a brand.

iOS 26 Won’t Kill Your UTMs – Here’s Proof

Despite headlines warning of doom, our testing shows iOS 26 leaves Northbeam’s UTMs untouched.
what-is-fcblid-guide-to-facebook-click-identifiers-and-tracking-ad-performance

What is fbclid? A Complete Guide to Facebook Click Identifiers and Tracking Ad Performance

This small URL parameter powers big improvements in Meta ad attribution

What Is Data-Driven Marketing? A Complete Guide to Transforming Your Marketing Strategy with Data

Leverage data to improve your marketing strategies

Why You Should Care About MTA, MMM, and Incrementality

Transform Your Marketing Performance
A futuristic cityscape with a glowing digital figure and a person studying analytics, symbolizing insights into Return on Ad Spend and mastering return on ad spend, with the Northbeam logo and text overlay.

What Is ROAS? A Beginner’s Guide to Return on Ad Spend

Learn why ROAS matters and how to maximize your returns
What makes Northbeam data different

What Makes Northbeam Data Different?

Not All Data is Created Equally

What to Expect When Switching to Northbeam

Everything You Need to Know When You Try Out Northbeam
Illustration of pixel tracking concept with magnifying glass over mechanical gears, symbolizing data analysis, and Northbeam logo in the top corner. Text reads: 'What is Pixel Tracking?

What is Pixel Tracking?

Unlock the Power of Pixel Tracking for Better Marketing Insights
What is Multi-Touch Attribution (MTA)?

Multi-Touch Attribution Models: A Complete Guide to Measuring Every Marketing Touchpoint

Understand, compare, and implement MTA for smarter marketing measurement

What is Media Mix Modeling (MMM)?

Wondering what exactly comprises Media Mix Modeling? Get a comprehensive overview of MMM

What is Marketing ROI and How Can You Improve It?

Understand and enhance your marketing ROI
Image of a man utilizing applovin on his phone and measuring the impact of his adds using Northbeam, the multi touch attribution solution for profitable growth

What is AppLovin and How to Leverage it For Marketing Success

Why DTC brands are flocking to AppLovin, and how to make it work for you

What is Marketing Intelligence Software?

Capture the right data for informed marketing decisions
This highlights key marketing metrics with a creative scene of a strategist building a futuristic ship, symbolizing innovation and long-term success strategies, with the Northbeam logo and text overlay.

Top Marketing Metrics to Track for Long-Term Success

Track these essential metrics to drive sustainable growth

What Is Incrementality In Marketing? A Guide to Measuring True Campaign Impact

The Critical Role of Attribution Models in Unlocking Growth
Northbeam presents a marketer’s guide to customer journey mapping, featuring a relaxed professional at a desk, symbolizing strategic planning and marketing success.

The Marketer’s Guide to Customer Journey Mapping

Turn messy customer paths into data-driven strategies for growth

The Future with YouTube Advertising

Navigating rising digital ad costs with Northbeam

The Marketer’s Guide to AI

How modern marketers can best harness the power of AI
Super Bowl Football Field with the Super Bowl logo and Northbeam logo sitting on the 50 yard line

Super Bowl 2025 Advertising Trends & Performance Analysis

The Big Game, Big Spends, and Even Bigger Marketing Moves

Performance Benchmarks: Black Friday Cyber Monday 2023

A look into this year's performance compared to last year.

Serious Data For Serious Growth: How Northbeam Enables HexClad To Stay Efficient with Scale

Leveraging Northbeam for scalable efficiency

The 2024 Guide to Incrementality

A guide to measuring marketing impact

Northbeam's Definitive Guide to Q5 2025

A Northbeam guide to the "hidden" fifth quarter
Abstract illustration showcasing individuals standing on interconnected platforms with glowing gears, representing probabilistic and deterministic approaches in a cookieless future, with the Northbeam logo and text overlay.

Probabilistic vs. Deterministic Attribution Approaches In a Cookieless Future

Combine probabilistic and deterministic models for future-proof attribution

How Will Cookie Deprecation Affect Northbeam? An Explainer

Northbeam's resilience amid third-party cookie deprecation
Northbeam showcases a futuristic city with holographic figures, drones, and digital interfaces, guiding ecommerce brands on Meta's new sensitivity category restrictions.

Meta’s Sensitivity Category Restrictions: A Guide for Ecommerce Brands

How to get to grips with Meta's privacy restrictions

Beyond Walled Gardens: How Marketers Can Thrive in a Fragmented Digital Landscape

Embrace open web strategies in the evolving digital ad landscape
How to Not Get Fired: A 5-Step Guide for CMOs

How To Not Get Fired: A 5-Step Guide for CMOs

Secure your role amid a shifting marketing landscape

Media Mix Modeling (MMM): Build or Buy?

Evaluating the best approach to implementing MMM

Marketing Efficiency Ratio (MER): Definition, Benchmarks, and How it Differs from ROAS

Use MER and ROAS Together for Smarter Decisions
Northbeam is powered by AI, and so will you.

How does Northbeam use AI?

Northbeam's advanced ML models enhance marketing performance
Cost per clicks

Do Cost Per Clicks Matter?

Evaluating the significance of CPC in performance marketing

Google Chrome Won’t be Deprecating Cookies — Yet

Google's decision to retain third-party cookies, and what it means for you
Utm Tracking 101 How To Use Utm Parameters To Measure Campaigns

UTM Tracking 101: How to Use UTM Parameters to Measure and Improve Campaign Performance

Learn how to use UTM parameters to track campaign performance, improve attribution, and optimize ROI with this step-by-step guide for marketers.
Northbeam presents Black Friday and Cyber Monday 2024 predictions and performance with a futuristic digital sphere, symbolizing data-driven insights and analysis.

BFCM 2024 Predictions: How Did We Do?

Wins, surprises, and lessons for 2025
Northbeam presents a seamless omnichannel marketing strategy with a historical meeting room and futuristic digital elements, symbolizing innovation and best practices.

Creating a Seamless Omnichannel Marketing Strategy: Tips & Best Practices

Mastering Omnichannel Marketing by creating a Seamless, Data-Driven Customer Journey
Northbeam highlights customer retention with an elegant historical setting, symbolizing long-term relationships and why retention should be every marketer’s priority.

Beyond Acquisition: Why Retention Should Be Every Marketer’s Priority

Shifting Focus: Why Retention Is the Key to Sustainable Growth and Profitability
Company Northbeam creates an ad spend optimization with a vintage airplane in a high-tech workshop, symbolizing innovation and maximizing Return on Investment from every marketing dollar.

Ad Spend Optimization: How to Get More ROI from Every Marketing Dollar

Stop Wasting Ad Spend: How Smarter Strategies and Tools Can Maximize ROI
Futuristic laboratory scene with advanced technology screens, DNA graphics, and a scientist analyzing data, representing innovation strategies for return on investment with Northbeam during economic uncertainty, with the Northbeam logo and text overlay.

5 Strategies to Maximize ROI During Economic Uncertainty

Use data-driven techniques to thrive during challenging times
a vibrant digital marketing control room with gears, graphs, and data screens, illustrating insights from a beginner's guide to marketing attribution, with a Northbeam logo and overlay.

A Beginner’s Guide to Marketing Attribution: Understanding the Fundamentals

Learn what marketing attribution is and how to harness its power in an ever-changing digital landscape
Northbeam is the perfect tool for performance marketing agencies.

5 Reasons Why Northbeam is the Perfect Tool for Performance Marketing Agencies

The Last Thing You Should Worry About Is Accurate Data

Accounting Modes 101: What Marketers Need to Know

Understanding cash snapshot and accrual performance modes

2025 Marketing Trends to Watch Out For: Part 2

CTV growth, evolving search, nano-influencers, and data privacy

2025 Marketing Trends to Watch Out For: Part 1

Navigating a Shifting Landscape of Generative AI, Social Media, and Data Privacy

It's time to take your marketing

to the next level.

Chat with our team and discover how Northbeam can transform your business.
book a demo