Blog

Cyber Week 2025: A Data‑Driven Look at Performance and Strategy

A data-driven look at how DTC brands actually performed during Cyber Week 2025, and why you should adjust your channel mix, pacing, and benchmarks before next year.
Cyber Week 2025 A Data Driven Look At Performance And Strategy

TL;DR

  • Cyber Week 2025 demand remained strong, with revenue and MER outpacing spend despite higher first-time CAC.
  • The promo window widened as brands seeded demand earlier in November and harvested conversions during peak week.
  • Meta and Google stayed the core budget spine while channels like TikTok, Pinterest, and YouTube added incremental upper-funnel reach.
  • Performance varied sharply by brand size and industry, making updated benchmarks and category-specific strategies essential for 2026.

This article, our associated whitepaper, and the webinar I hosted, are based on Northbeam’s internal proprietary Clicks-Only data.

For DTC brands, Cyber Week 2025 wasn’t just “another record year.” It was a clear signal that peak season is now a strategy game, not a “spend big and hope for the best” game.

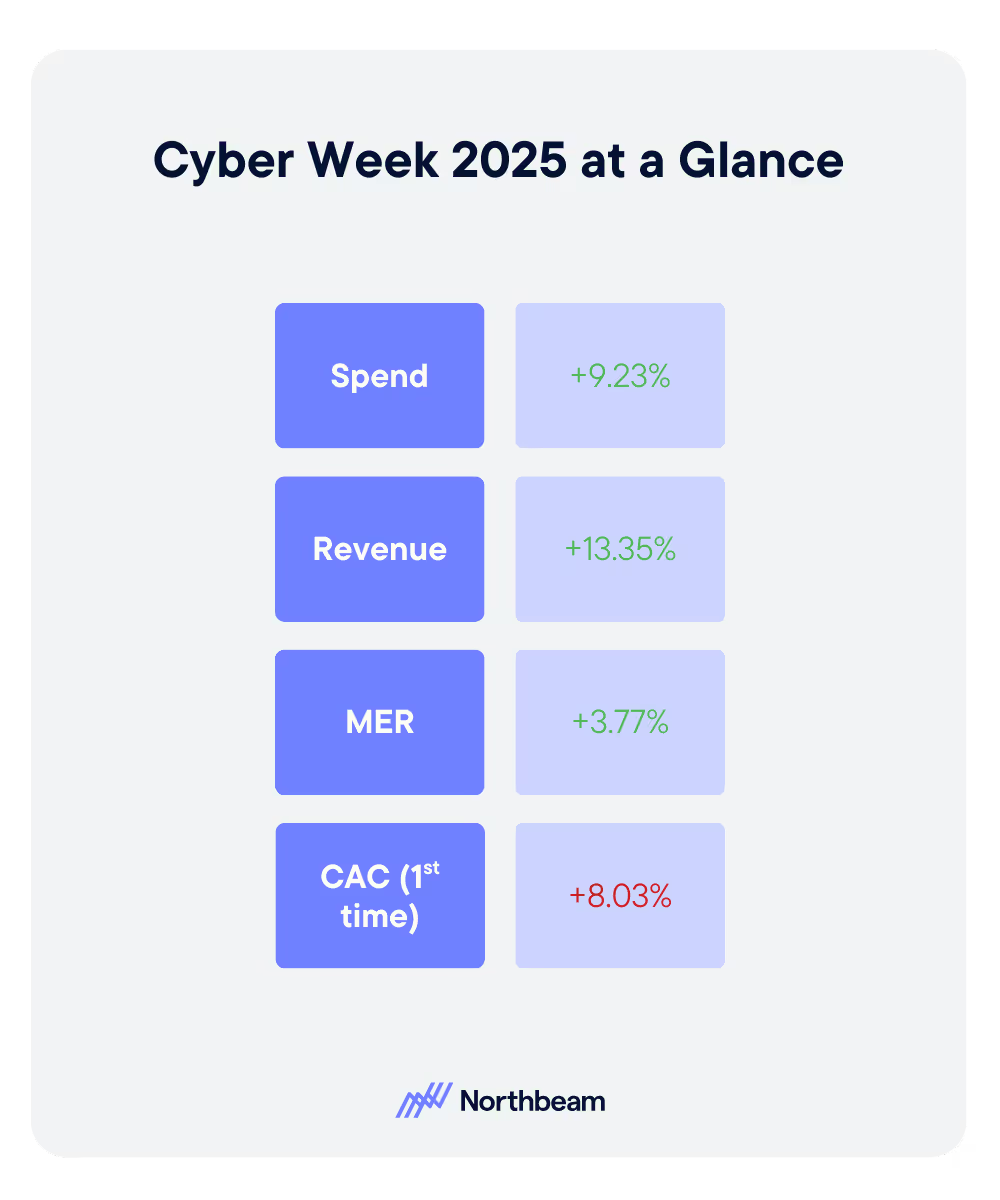
Across Northbeam’s customer base, we saw ad spend rise by just over 9% year over year, while revenue grew more than 13%, lifting MER even as first‑time CAC climbed about 8%. In other words: shoppers are still willing to buy, but they’re a lot more selective about when and how they convert.

This blog is a high‑level walkthrough of what we saw across thousands of DTC brands during Cyber Week 2025, and how the best teams are already adjusting their playbooks for 2026.

If you want the full channel‑by‑channel, industry, and company‑size breakdowns, grab the report this blog is based on:

Get the full data set: Download the BFCM 2025: The Report whitepaper for all charts, daily breakdowns, and industry cuts.

1. The window keeps widening: seed early, harvest late

Long gone are the days of lining up outside a big‑box retailer at midnight. The in‑store moment may have faded, but the online punch of Black Friday/Cyber Monday is absolutely still there, it just starts earlier and stretches longer.

When we looked at the 21‑day run‑up to Cyber Week (Nov 4–24), a few things stood out:

  • Brands increased spend in the lead‑up; roughly mid‑single digits overall.
  • Revenue in that same period grew a bit faster than spend.
  • First‑time CAC jumped sharply, into the mid‑teens percentage‑wise.

Put simply, advertisers were priming the pump. They were willing to pay more to get in front of new customers before the sale, knowing that a meaningful chunk of that demand would only convert once the “real” offers went live.

That’s conversion lag in practice:

Dollars spent early in November convert during the sale itself, sometimes days or even weeks later.

If you only look at 1‑day click ROAS in‑platform, this early‑month spend can look terrible. When you look at it through a multi‑touch, cross‑channel lens, it suddenly becomes clear that your “expensive” pre‑BFCM dollars are actually doing a lot of the heavy lifting for peak week performance.

In the full report: we break down the Nov 4–24 period in more detail and show exactly how spend, revenue, MER, and first‑time CAC moved during those three weeks.

Watch the full webinar I hosted right here!

2. Cyber Week is a week‑long arc, not a single spike

From a distance, Cyber Week still looks like what you’d expect: spend ramps into Black Friday, stays elevated through Cyber Monday, then cools off. But when you zoom in day‑by‑day, the pattern is a lot more instructive.

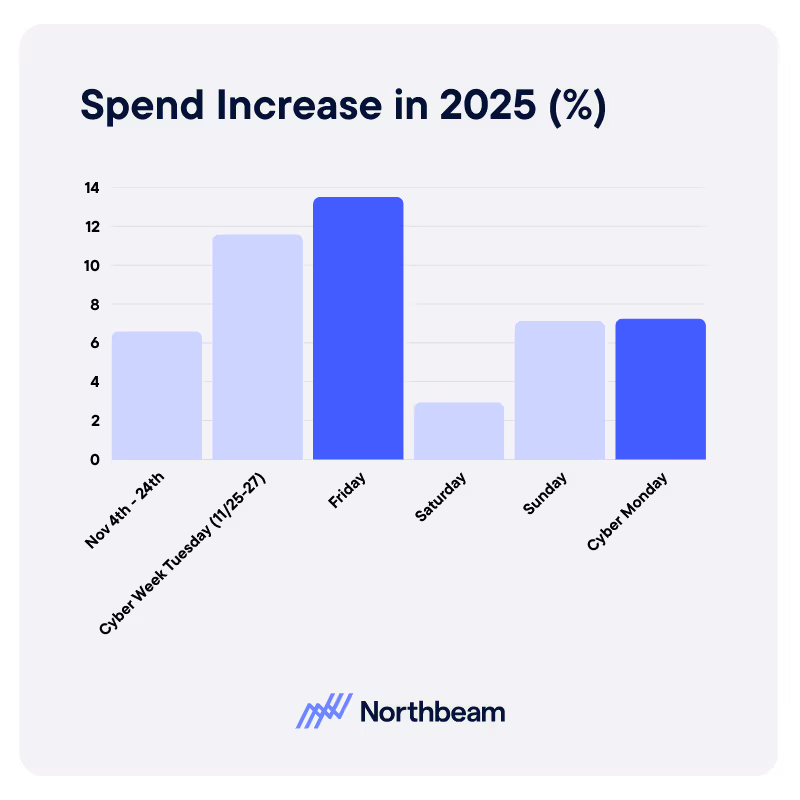
Here’s the simplified version of what we saw:

  • Tue–Thu (pre–Black Friday)
    Brands ramped into the peak. Spend and revenue both moved up double‑digits vs. last year, MER improved modestly, and CAC started to climb as consumers browsed and waited.
  • Black Friday
    Still the single biggest spend day of the week, but also the point where efficiency compressed the most. MER dipped relative to 2024 while CAC jumped by the mid‑teens as auctions got crowded and everyone piled in at once.
  • Saturday & Sunday
    Many brands pulled back on spend on Saturday, and MER actually rebounded as the most motivated shoppers kept converting. By Sunday, both spend and revenue started to pick up again heading into Monday.
  • Cyber Monday
    Spend re‑accelerated and efficiency improved vs. Black Friday, MER climbed, and CAC rose more modestly. This is the “I’ve been browsing all weekend and I’m finally pulling the trigger” behavior we heard anecdotally across accounts.

This is why we’re pushing clients to stop thinking in terms of “What’s my Black Friday budget?” and start thinking in terms of “What’s my Cyber Week arc?”

Some practical implications:

  • You don’t need to front‑load 100% of your aggression into Friday. If you’re not seeing the results you expected, there’s a strong case for shifting some budget into Sunday/Monday next year, where competition can be slightly softer and intent is still high.
  • When you evaluate performance, judge the week as a system, not as isolated days. A “weak” Thursday on a click‑only view might be exactly what you need to make Monday a record day.

3. Meta and Google still own the spine, but diversification is real

Despite all the noise about new platforms, Meta and Google are still the foundation of DTC performance marketing during Cyber Week.

Across our dataset:

  • Together, Meta and Google represented roughly 80% of Cyber Week digital ad spend.
  • Both platforms delivered strong revenue growth year over year and improvements (or stability) in short‑window ROAS, even as overall auctions remained competitive.

In other words: if you’re trying to build a BFCM media plan without Meta and Google as your budget spine, you’re swimming upstream.

That said, we did see meaningful wallet‑share movement elsewhere:

  • TikTok: Brands significantly increased spend here, and revenue kept pace, especially for those willing to lean into video‑heavy prospecting and measure impact with Clicks + Deterministic Views (C+DV) instead of click‑only.
  • Pinterest: Also saw solid budget growth. Performance was more mixed across accounts, but for visual, giftable categories, Pinterest remained a strong discovery and conversion assist channel.
  • YouTube: Interestingly, we saw a slight decline in wallet share but much stronger revenue growth and ROAS among brands that stuck with it — alongside significantly cheaper CPMs. To us, that’s a classic sign of a channel that looks “meh” in last‑click, but quietly delivers revenue when you look at it through a multi‑touch lens.

The core takeaway:

Use emerging channels to diversify reach, not to “replace” Meta/Google.

Your job is to build a spine (Meta + Google), then layer in TikTok, Pinterest, YouTube, Snap, etc. in a way that actually adds incremental lift rather than just cannibalizing what you already have.

In the full report: we show detailed wallet share shifts, CPM/ROAS changes by platform, and a simple set of “rules of thumb” for how much budget most brands are safely putting into each non‑core channel today.

4. Size and category dictated who actually “won” Cyber Week

On aggregate, Cyber Week looks great. Under the hood, performance diverged sharply by company size and industry.

By company size

When we segmented brands by annual revenue, three different stories emerged:

  • Large brands (>$100M)
    • Spend up high single digits.
    • Revenue up mid‑teens.
    • MER up meaningfully, with only a small CAC increase.
  • These teams tended to have their BFCM strategy dialed in — from promo structure to channel mix to upper‑funnel measurement.
  • Mid‑market brands ($10M–$100M)
    • Biggest increase in investment.
    • The sharpest spike in CAC.
    • MER roughly flat year over year.
  • Growth was there, but it often came without efficiency gains. These are the brands that felt the most pressure from auction dynamics.
  • Smaller brands (<$10M)
    • More cautious on spend.
    • Modest revenue lift.
    • Small MER improvements, but less ability to simply “buy their way” into the peak.

By industry

We also saw clear category‑level winners and laggards:

  • Strong performers:
    • Beauty & Personal Care — grew spend and revenue, while actually improving first‑time CAC, making it one of the standout categories this year.
    • Fashion & Accessories — consumers rewarded increased investment with outsized revenue growth; still a core Q4 gifting engine.
    • Home & Furniture — solid returns suggest that considered, higher‑ticket purchases still respond well to strong seasonal offers.
    • Sporting Goods & Fitness — brands that pulled back spend actually improved unit economics significantly, creating room to re‑invest smarter in 2026.
  • Slower performers:
    • Food & Beverage — advertisers pulled back, which helped stabilize MER, but rising CAC and modest revenue growth point to a tougher environment.
    • Health & Wellness — arguably the most challenged category in the dataset: heavy investment, softer revenue, sharply higher CAC. Many brands tried to pull forward their usual Q1 “new year, new me” demand into Cyber Week — and it didn’t fully pay off.

The key message:

Your BFCM strategy has to be category‑specific. Elasticity, gifting dynamics, purchase frequency, and payback windows are wildly different by vertical — your benchmarks and budget ladders should be, too.

5. What to do now: four moves before you plan BFCM 2026

Coming out of Cyber Week, here’s how I’d recommend you operationalize these learnings.

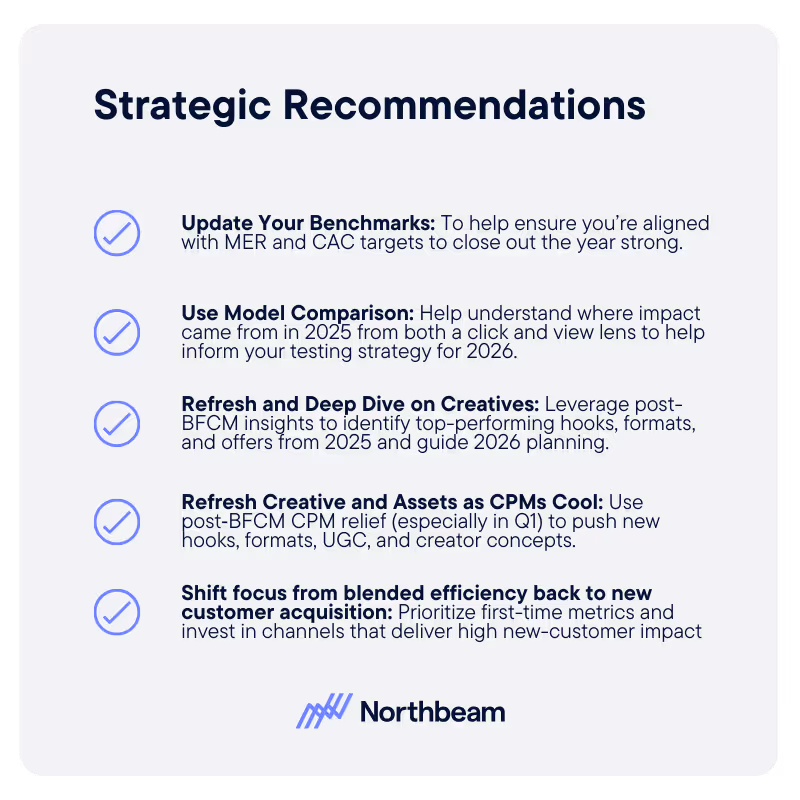
1. Reset your benchmarks

Your “peak week” numbers are already out of date. Update:

  • MER and CAC targets back to a more business‑as‑usual range.
  • Channel‑level ROAS guardrails so your teams don’t keep optimizing to Black Friday conditions in January.

If you’re with Northbeam, this is a great time to align your Benchmarks/Stoplights with what “good” actually looks like post‑BFCM.

2. Use model comparison to understand what really drove 2025

If you only look at click‑only models, you’ll wildly underestimate:

  • Upper‑funnel channels like TikTok, YouTube, Snapchat.
  • Video‑heavy and creator/UGC campaigns.
  • The early‑November “seed” campaigns that set up your Cyber Week harvest.

Swap between Clicks‑Only and Clicks + Deterministic Views (C+DV) in your reporting to see where net‑new demand actually came from in 2025, and use that to inform where you test harder in 2026.

3. Test smarter with MMM and incrementality

Media mix modeling (MMM) and incrementality testing have gone from “nice to have” to non‑negotiable:

  • Use MMM to re‑forecast your 2026 channel mix based on what worked in 2025 — especially if you’re trying to push into new channels without blowing up CAC.
  • Use incrementality tests to validate that your “growth channels” are actually adding incremental revenue, not just shifting credit around. Northbeam’s new incrementality solution also feeds those learnings back into MMM, so your model gets smarter, faster.

4. Lean back into creative and asset experimentation as CPMs cool

CPMs almost always cool off post‑BFCM, especially in Q1. That’s your window to:

  • Launch new hooks, formats, and UGC concepts across your highest‑elasticity categories.
  • Refresh offers and funnels for categories that struggled this year (looking at you, health & wellness and F&B) before you repeat 2025’s spend levels.
  • Systematically log top‑performing creative from 2025 so you’re not reinventing the wheel next November.

Want the full data and all the charts?

This blog barely scratches the surface of what we saw in the data.

If you’re planning budgets for 2026 — or just trying to sanity‑check how your brand stacked up — I’d strongly recommend digging into the full whitepaper:

Download the full BFCM 2025: The Report to get:

  • Day‑by‑day Cyber Week performance (Tue–Mon)
  • Channel mix and wallet‑share shifts, including TikTok, Pinterest, YouTube, Snap, and more
  • Performance by company size and industry, with detailed MER and CAC changes
  • A deeper dive on how to use C+DV, MMM, and incrementality together

Cyber Week 2025 made one thing clear: the demand is still there — but the brands that win are the ones that plan, measure, and adapt smarter than everyone else.

Continue Reading

Second Party Data Tapping Into Trusted Partner Data For Marketing

Second-Party Data: Tapping Into Trusted Partner Data for Marketing

A Practical Guide to Partner-Sourced Data
Is Your Company Data Mature Understanding Data Maturity Models For Marketing

Is Your Company Data-Mature? Understanding Data Maturity Models for Marketing

Is Your Team Really “Data Driven?”
Introducing Incrementality By Northbeam: Automated Lift Testing You Can Trust

Introducing Incrementality by Northbeam: Automated Lift Testing You Can Trust

Run incrementality tests end-to-end inside Northbeam—automated design, rigorous validation, and unified results alongside your MTA and MMM for confident, daily decision-making.
Reporting on Marketing Automation Performance: Proving the ROI of Your Drip Campaigns

Reporting on Marketing Automation Performance: Proving the ROI of Your Drip Campaigns

Measure, Attribute, and Prove Business Value
Marketing Funnel Automation Scaling Engagement On Autopilot

Marketing Funnel Automation: Scaling Engagement on Autopilot

Build, Automate, and Measure
Why New Customer ROAS Matters More Than Blended Metrics

Why New Customer ROAS Matters More Than Blended Metrics

Why optimizing to New Customer ROAS (nROAS) — not blended ROAS — is the only way to scale net‑new growth, with a simple daily workflow to make it operational.
Channel Strategy How To Choose The Right Marketing Channels For Your Business

Channel Strategy: How to Choose the Right Marketing Channels for Your Business

Evaluate, Test, and Optimize Your Marketing Channels
Ad Fatigue In Digital Marketing How To Recognize And Remedy It

Ad Fatigue in Digital Marketing: How to Recognize & Remedy It

How to Know When Your Audience Has Seen Enough
Churn Analysis Identifying Why Customers Leave And How To Win Them Back

Churn Analysis: Identifying Why Customers Leave (And How to Win Them Back)

Uncover Churn Drivers and Build Stronger Retention Strategies
Funnel Creation Made Simple How To Map Out Your Marketing Funnel

Funnel Creation Made Simple: How to Map Out Your Marketing Funnel

Map, Measure, and Optimize the Customer Journey
Kill Last Click Bias A Simple Playbook For Read During BFCM

Kill Last‑Click Bias: A Simple Playbook for Reads During BFCM

A practical, windowed-read playbook—short for capture, longer for prospecting—to avoid last‑click bias during Cyber Five.
The Cyber Five Pattern What To Expect Heading Into BFCM

The Cyber Five Pattern: What to expect Heading Into BFCM

Planning Cyber Five with pattern‑based pacing and clear measurement reads.
What Is MAU Tracking Monthly Active Users To Gauge Growth

What Is MAU? Tracking Monthly Active Users to Gauge Growth

Learn what Monthly Active Users (MAU) means, how to measure it accurately, and how to use MAU trends to improve product engagement, retention, and growth.
User Segmentation Strategies How To Personalize Marketing For Every Audience

User Segmentation Strategies: How to Personalize Marketing for Every Audience

Learn how to build and activate user segments that power personalized marketing, boost engagement, and drive long-term customer loyalty.
Which Campaigns Benefit Most From CDV

Which Campaigns Benefit Most from C+DV? Prospecting, Reach/Traffic, and Retention by the Numbers

Learning How C+DV Evens the Playing Field
Fogg Behavior Model: Motivation, Ability, and Prompts

Fogg Behavior Model: Motivation, Ability, and Prompts

Apply Behavior Design Principles to Your Marketing Strategy
Lifecycle Marketing 101 For Every Stage Of The Customer Journey

Lifecycle Marketing 101: Engaging Customers at Every Stage of the Journey

Build Customer Relationships That Last

Benchmarks & Stoplights: Turning Data Into Daily Decisions for Ad Optimization

Turn your best performance days into a live decision system with clear green, yellow, and red signals—so your team knows exactly when to scale, pause, or pivot.
Behavioral Data In Marketing How User Behavior Drives Growth

Behavioral Data In Marketing: How User Behavior Drives Growth

Optimize journeys and personalize experiences
Cohort Analysis For Marketers Uncovering Trends In Customer Behavior

Cohort Analysis for Marketers: Uncovering Trends In Customer Behavior

Learn how to use cohort analysis to track retention, forecast LTV, and drive sustainable growth.
User Stickiness How To Measure Customer Engagement Metric

User Stickiness: The Metric to Measure Customer Engagement (and How to Improve It)

Discover how to calculate and improve user stickiness (DAU/MAU) — the key metric for measuring customer engagement and loyalty.

The PESO Model: Integrating Paid, Earned, Shared, and Owned Media

Learn how the PESO model unifies Paid, Earned, Shared, and Owned media into one powerful strategy.
reasons your awarness campaigns arent driving revenue

7 Reasons Your Awareness Campaigns Aren’t Driving Revenue

How evolving attribution models, creative strategy, and platform dynamics are redefining top-of-funnel success this BFCM season.

How Omnilux Drove a 659% ROAS Lift on Pinterest with Northbeam’s Clicks + Deterministic Views

A case study with Northbeam's newest attribution model.
Clicks + Deterministic Views, by Northbeam.

Introducing Clicks + Deterministic Views by Northbeam

A revolutionary new viewthrough model, now available in Northbeam.

Contextual Targeting In Advertising: Reaching Audiences Without Cookies

Discover how contextual targeting delivers privacy-first, high-performing ads without cookies.

First vs Second vs Third-Party Data: What Are They and Why They Matter

Learn the differences between first-, second-, and third-party data.

Zero-Party Data: The New Gold Standard in Privacy-First Marketing

Learn best practices for collection, activation, and governance to drive trust and ROI.
The Explore Exploit Cycle Of Meta's Algorithm

The Explore–Exploit Cycle of Meta’s Algorithm

Why Meta’s algorithm makes performance swing — and how to ride the cycle instead of panicking through the dips.
what-is-gclid-complete-guide-to-google-click-identifier

What Is GCLID? Complete Guide to Google Click Identifier

Learn what GCLID is, how it works, and why it’s essential for accurate Google Ads tracking.
beyond roas fundamentals of advertising hero

Beyond ROAS: Fundamentals of Advertising In 2025

Why relying on ROAS alone can stunt growth—and the metrics that reveal if your ads are truly building a brand.

iOS 26 Won’t Kill Your UTMs – Here’s Proof

Despite headlines warning of doom, our testing shows iOS 26 leaves Northbeam’s UTMs untouched.
what-is-fcblid-guide-to-facebook-click-identifiers-and-tracking-ad-performance

What is fbclid? A Complete Guide to Facebook Click Identifiers and Tracking Ad Performance

This small URL parameter powers big improvements in Meta ad attribution

What Is Data-Driven Marketing? A Complete Guide to Transforming Your Marketing Strategy with Data

Leverage data to improve your marketing strategies

Why You Should Care About MTA, MMM, and Incrementality

Transform Your Marketing Performance
A futuristic cityscape with a glowing digital figure and a person studying analytics, symbolizing insights into Return on Ad Spend and mastering return on ad spend, with the Northbeam logo and text overlay.

What Is ROAS? A Beginner’s Guide to Return on Ad Spend

Learn why ROAS matters and how to maximize your returns
What makes Northbeam data different

What Makes Northbeam Data Different?

Not All Data is Created Equally

What to Expect When Switching to Northbeam

Everything You Need to Know When You Try Out Northbeam
Illustration of pixel tracking concept with magnifying glass over mechanical gears, symbolizing data analysis, and Northbeam logo in the top corner. Text reads: 'What is Pixel Tracking?

What is Pixel Tracking?

Unlock the Power of Pixel Tracking for Better Marketing Insights
What is Multi-Touch Attribution (MTA)?

Multi-Touch Attribution Models: A Complete Guide to Measuring Every Marketing Touchpoint

Understand, compare, and implement MTA for smarter marketing measurement

What is Media Mix Modeling (MMM)?

Wondering what exactly comprises Media Mix Modeling? Get a comprehensive overview of MMM

What is Marketing ROI and How Can You Improve It?

Understand and enhance your marketing ROI
Image of a man utilizing applovin on his phone and measuring the impact of his adds using Northbeam, the multi touch attribution solution for profitable growth

What is AppLovin and How to Leverage it For Marketing Success

Why DTC brands are flocking to AppLovin, and how to make it work for you

What is Marketing Intelligence Software?

Capture the right data for informed marketing decisions
This highlights key marketing metrics with a creative scene of a strategist building a futuristic ship, symbolizing innovation and long-term success strategies, with the Northbeam logo and text overlay.

Top Marketing Metrics to Track for Long-Term Success

Track these essential metrics to drive sustainable growth

What Is Incrementality In Marketing? A Guide to Measuring True Campaign Impact

The Critical Role of Attribution Models in Unlocking Growth
Northbeam presents a marketer’s guide to customer journey mapping, featuring a relaxed professional at a desk, symbolizing strategic planning and marketing success.

The Marketer’s Guide to Customer Journey Mapping

Turn messy customer paths into data-driven strategies for growth

The Future with YouTube Advertising

Navigating rising digital ad costs with Northbeam

The Marketer’s Guide to AI

How modern marketers can best harness the power of AI
Super Bowl Football Field with the Super Bowl logo and Northbeam logo sitting on the 50 yard line

Super Bowl 2025 Advertising Trends & Performance Analysis

The Big Game, Big Spends, and Even Bigger Marketing Moves

Performance Benchmarks: Black Friday Cyber Monday 2023

A look into this year's performance compared to last year.

Serious Data For Serious Growth: How Northbeam Enables HexClad To Stay Efficient with Scale

Leveraging Northbeam for scalable efficiency

The 2024 Guide to Incrementality

A guide to measuring marketing impact

Northbeam's Definitive Guide to Q5 2025

A Northbeam guide to the "hidden" fifth quarter
Abstract illustration showcasing individuals standing on interconnected platforms with glowing gears, representing probabilistic and deterministic approaches in a cookieless future, with the Northbeam logo and text overlay.

Probabilistic vs. Deterministic Attribution Approaches In a Cookieless Future

Combine probabilistic and deterministic models for future-proof attribution

How Will Cookie Deprecation Affect Northbeam? An Explainer

Northbeam's resilience amid third-party cookie deprecation
Northbeam showcases a futuristic city with holographic figures, drones, and digital interfaces, guiding ecommerce brands on Meta's new sensitivity category restrictions.

Meta’s Sensitivity Category Restrictions: A Guide for Ecommerce Brands

How to get to grips with Meta's privacy restrictions

Beyond Walled Gardens: How Marketers Can Thrive in a Fragmented Digital Landscape

Embrace open web strategies in the evolving digital ad landscape
How to Not Get Fired: A 5-Step Guide for CMOs

How To Not Get Fired: A 5-Step Guide for CMOs

Secure your role amid a shifting marketing landscape

Media Mix Modeling (MMM): Build or Buy?

Evaluating the best approach to implementing MMM

Marketing Efficiency Ratio (MER): Definition, Benchmarks, and How it Differs from ROAS

Use MER and ROAS Together for Smarter Decisions
Northbeam is powered by AI, and so will you.

How does Northbeam use AI?

Northbeam's advanced ML models enhance marketing performance
Cost per clicks

Do Cost Per Clicks Matter?

Evaluating the significance of CPC in performance marketing

Google Chrome Won’t be Deprecating Cookies — Yet

Google's decision to retain third-party cookies, and what it means for you
Utm Tracking 101 How To Use Utm Parameters To Measure Campaigns

UTM Tracking 101: How to Use UTM Parameters to Measure and Improve Campaign Performance

Learn how to use UTM parameters to track campaign performance, improve attribution, and optimize ROI with this step-by-step guide for marketers.
Northbeam presents Black Friday and Cyber Monday 2024 predictions and performance with a futuristic digital sphere, symbolizing data-driven insights and analysis.

BFCM 2024 Predictions: How Did We Do?

Wins, surprises, and lessons for 2025
Northbeam presents a seamless omnichannel marketing strategy with a historical meeting room and futuristic digital elements, symbolizing innovation and best practices.

Creating a Seamless Omnichannel Marketing Strategy: Tips & Best Practices

Mastering Omnichannel Marketing by creating a Seamless, Data-Driven Customer Journey
Northbeam highlights customer retention with an elegant historical setting, symbolizing long-term relationships and why retention should be every marketer’s priority.

Beyond Acquisition: Why Retention Should Be Every Marketer’s Priority

Shifting Focus: Why Retention Is the Key to Sustainable Growth and Profitability
Company Northbeam creates an ad spend optimization with a vintage airplane in a high-tech workshop, symbolizing innovation and maximizing Return on Investment from every marketing dollar.

Ad Spend Optimization: How to Get More ROI from Every Marketing Dollar

Stop Wasting Ad Spend: How Smarter Strategies and Tools Can Maximize ROI
Futuristic laboratory scene with advanced technology screens, DNA graphics, and a scientist analyzing data, representing innovation strategies for return on investment with Northbeam during economic uncertainty, with the Northbeam logo and text overlay.

5 Strategies to Maximize ROI During Economic Uncertainty

Use data-driven techniques to thrive during challenging times
a vibrant digital marketing control room with gears, graphs, and data screens, illustrating insights from a beginner's guide to marketing attribution, with a Northbeam logo and overlay.

A Beginner’s Guide to Marketing Attribution: Understanding the Fundamentals

Learn what marketing attribution is and how to harness its power in an ever-changing digital landscape
Northbeam is the perfect tool for performance marketing agencies.

5 Reasons Why Northbeam is the Perfect Tool for Performance Marketing Agencies

The Last Thing You Should Worry About Is Accurate Data

Accounting Modes 101: What Marketers Need to Know

Understanding cash snapshot and accrual performance modes

2025 Marketing Trends to Watch Out For: Part 2

CTV growth, evolving search, nano-influencers, and data privacy

2025 Marketing Trends to Watch Out For: Part 1

Navigating a Shifting Landscape of Generative AI, Social Media, and Data Privacy

It's time to take your marketing

to the next level.

Chat with our team and discover how Northbeam can transform your business.
book a demo