


Winning marketing campaigns don’t just measure performance, they dig deeper to understand who is engaging and converting.
On LinkedIn, segment reporting makes this possible by turning professional demographics and company information into actionable data for targeting, creative, and budget.
In this context, segment reporting means analyzing campaign performance by specific audience slices: job function, seniority, industry, company size, company list membership, skills, and more.
Instead of relying on aggregate metrics that mask which roles or industries are truly performing, marketers can identify high-value segments and eliminate wasted spend. The result is a clearer picture of which audiences drive real pipeline and revenue.
This article will walk you through how to access LinkedIn’s audience analysis, interpret what the data is telling you, and build a repeatable workflow for segment-level analysis.
By the end, you’ll know not only how to read the reports but also how to act on them: refining targeting, sharpening creative, reallocating budgets, and ultimately delivering better ROI from every campaign.
What Is LinkedIn Segment Reporting & Why It Matters
LinkedIn segment reporting is a structured approach to analyzing campaign performance through the lens of professional demographics and firmographics.
Instead of looking at aggregate results alone, you break performance down by audience slices like job function, seniority, industry, company size, company list membership, skills, and more. This level of granularity shows you not just how campaigns perform overall, but which specific audiences are driving value.
The result is more informed decisions about where to focus your targeting, creative, bids, and budgets.
Why LinkedIn segment reporting matters:
- Precision targeting: Analyze LinkedIn ad audiences by job titles, seniority levels, and industries that generate efficient reach and higher-quality conversions.
- ABM enablement: Validate whether priority accounts and lookalike audiences are truly engaging, then double down where coverage or resonance is strongest.
- Budget clarity: Go beyond broad CPA averages. Reroute dollars toward segments with greater down-funnel impact and ROI.
- Creative guidance: Compare segment-level performance to align headlines, value propositions, and formats with the unique needs of decision-makers.
Segment reporting is the bridge between LinkedIn’s audience analysis data and practical media decisions. By using demographics to optimize LinkedIn ads, you can refine targeting, sharpen creative, and reallocate budgets to the audiences that actually move pipeline and revenue.
Core Tools & Access Paths
If you’re wondering how to segment LinkedIn ad performance, the platform provides multiple ways to dig into audience insights and segment performance.
Whether you’re planning a campaign, optimizing live ads, or scaling through automation, these tools give you the data you need to make informed decisions.
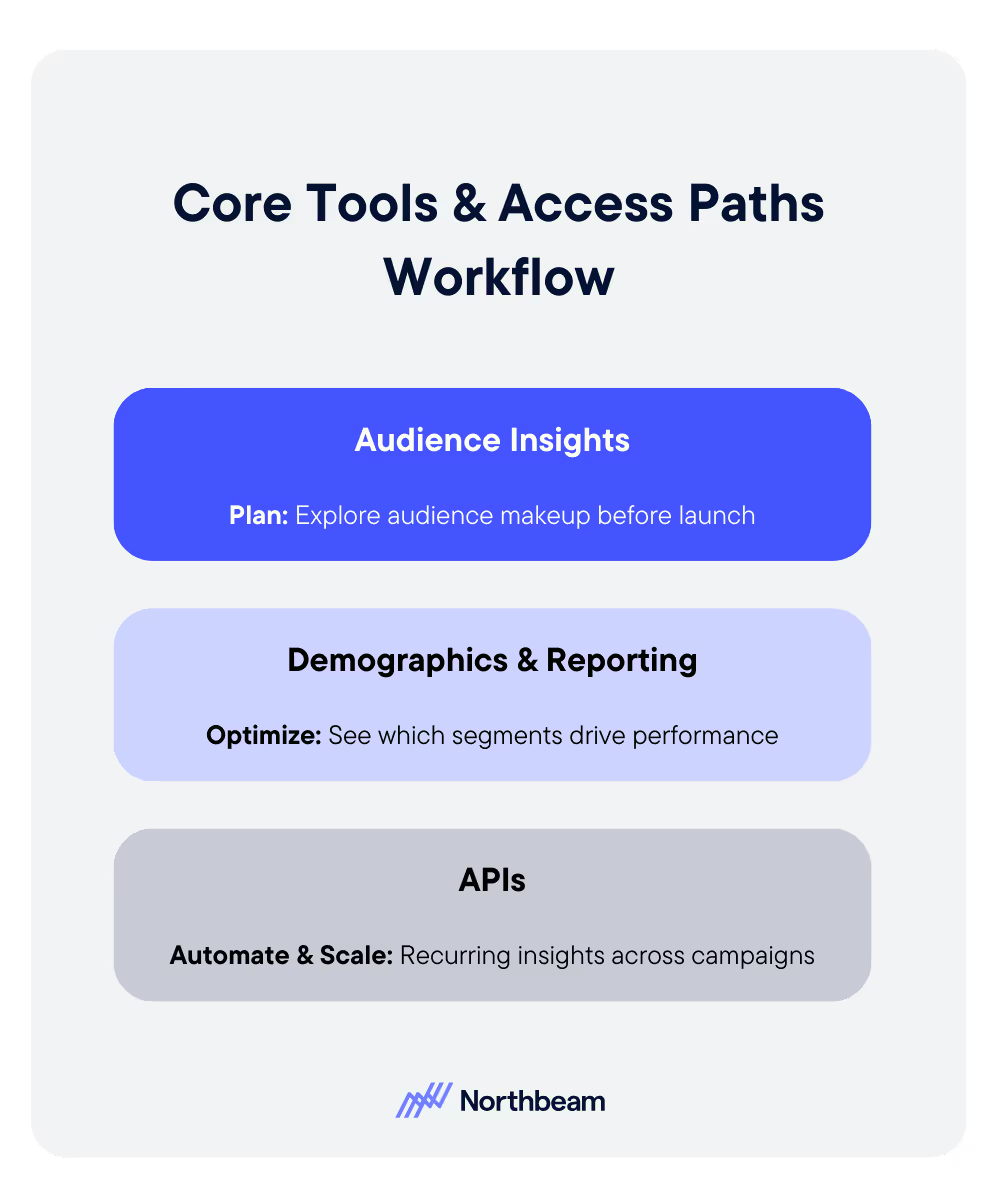
Campaign Manager, Audience Insights (pre-launch and always-on)
Audience Insights helps you understand the makeup of your target audiences before you even launch.
You can explore LinkedIn’s matched audiences reporting, and save audiences by job function, titles, seniority, industry, company size, skills, interests, and more.
This view validates whether your audience definition matches your goals and highlights adjacent segments worth testing.
Campaign Manager, Demographics (live campaigns)
Once campaigns are live, the Demographics tab in Campaign Manager analytics shows which professional cohorts are actually driving performance.
You can break down impressions, engagement, and conversions by job title, seniority, industry, and other factors.
Filters for objective, date range, and campaign hierarchy (account, group, campaign, or ad) make it easy to pinpoint where performance diverges.
Reporting Dashboards & Exports
For deeper analysis, saved reporting views let you track segment-level KPIs such as impressions, CTR, leads, cost per lead, and conversions.
Exporting CSVs makes it simple to compare cohorts across campaigns or over time. Cohort-style tables, broken out by week or month, help you spot durable segment winners rather than short-lived spikes.
APIs (high-level, vendor-neutral)
For advanced teams, LinkedIn Audiences and Linkedin Ad Reporting API endpoints offer programmatic access to demographic breakdowns and performance data.
This is especially valuable for organizations running account based marketing (ABM) programs, frequent experiments, or multi-market rollouts, where standardized dashboards and recurring QA checks are critical.
API reporting for LinkedIn audiences enables automation, ensuring you can scale insights across regions, campaigns, and teams without manual effort.
How to Read & Interpret Segment Reports
Segment reports are most useful when you know which dimensions to focus on and how to separate signal from noise.
By looking beyond surface-level metrics, you can uncover which audiences are actually driving qualified engagement and pipeline.
Key dimensions to monitor include:
- Job function vs. job title: Broad functions reveal trends, while titles give you role-specific nuance.
- Seniority: Helps distinguish between influencers and decision-makers.
- Industry and company size: Pinpoint where your message resonates most strongly.
- Location and account list membership: Ensure coverage in priority markets or ABM lists.
- Skills and interests: Identify emerging pockets of relevance you might not have considered.
Patterns to look for include:
- High engagement, low conversion: Creative resonates but the offer or landing page doesn’t. Test clearer CTAs or deeper content.
- High conversion, low reach: Indicates a strong but narrow segment. Expand with lookalikes, audience growth, or broader title nets within the same function/seniority.
- Seniority spread: If independent contributors click but managers convert, split creative streams to address each layer’s specific challenges and motivations.
- Industry outliers: When certain verticals overperform, spin up industry-specific ads or landing pages to capitalize on momentum.
Common pitfalls to watch out for include:
- Over-segmentation: Tiny cohorts can run into privacy thresholds or lack statistical reliability.
- Mismatched attribution windows: Comparing metrics tracked on different goals or timeframes skews interpretation.
- Short-term spikes: Press coverage or promos can inflate a segment temporarily. Don’t mistake anomalies for durable performance.
The takeaway is that you should read segment reports with both precision and context, with the goal of building a reliable picture of which audiences consistently deliver value.
Strategies & Plays Enabled by Segment Reporting
Segment reporting isn’t just about understanding what happened; it’s about using insights to shape smarter campaigns.
With the right read of audience-level performance, you can refine targeting, sharpen creative, and plan budgets with far more confidence.
Targeting Refinement
Trim underperforming segments, even when their CPAs look “cheap” on the surface. Low-quality leads waste sales resources.
Expand into adjacent roles within high-performing functions. For example, if finance directors perform well, test controllers or VPs with layered seniority filters.
ABM Coverage & Density
Map segment performance against your ABM account lists to see which departments and seniorities are underrepresented.
Build micro-plays tailored to different buying group roles (e.g., economic buyer vs. champion) with distinct messaging and offers.
Creative and Message Testing
Run side-by-side ads for top job functions: leadership messaging vs. operator-level messaging.
Use segment metrics to reveal which value propositions (efficiency, risk reduction, revenue growth) resonate most before scaling spend.
Offer and Format Strategy
If technical roles engage but don’t convert, test deep-dive assets like comparison guides or product sheets.
For executives, emphasize outcomes and ROI. Match ad formats to preferences: document ads for procurement, short videos for time-strapped execs.
Forecasting & planning
Apply historical segment performance to estimate reach, clickthrough rate (CTR), and cost per lead (CPL) at different budget levels by market or vertical.
Prioritize testing in areas with the highest modeled impact on pipeline, not just the cheapest clicks.
Automation & QA
Create a recurring dashboard view (or API-powered workflow) to monitor top segments weekly.
Automate alerts for performance deterioration, surface new opportunities, and track lift after creative refreshes.
Segment reporting transforms guesswork into a repeatable playbook so you can ensure budget and creative energy go where they’ll have the most impact.
Tools, Data, and Setup
The value of segment reporting depends on the quality of your data and the discipline of your setup. Without clean tracking, well-constructed audiences, and a repeatable workflow, insights can easily get muddled or misapplied.
Tracking and Data Hygiene
- Confirm that website and conversion tracking is properly implemented via the LinkedIn pixel or Conversions API.
- Ensure offline conversions and CRM leads sync reliably so that segment learnings tie back to real revenue.
- Standardize UTM parameters across campaigns to reconcile top-of-funnel engagement with down-funnel metrics.
Audience Construction
- Define clear inclusion and exclusion rules for saved and matched audiences. Document naming conventions and change history to maintain transparency.
- Align account lists directly with sales priorities, refreshing them regularly through uploads or connected integrations.
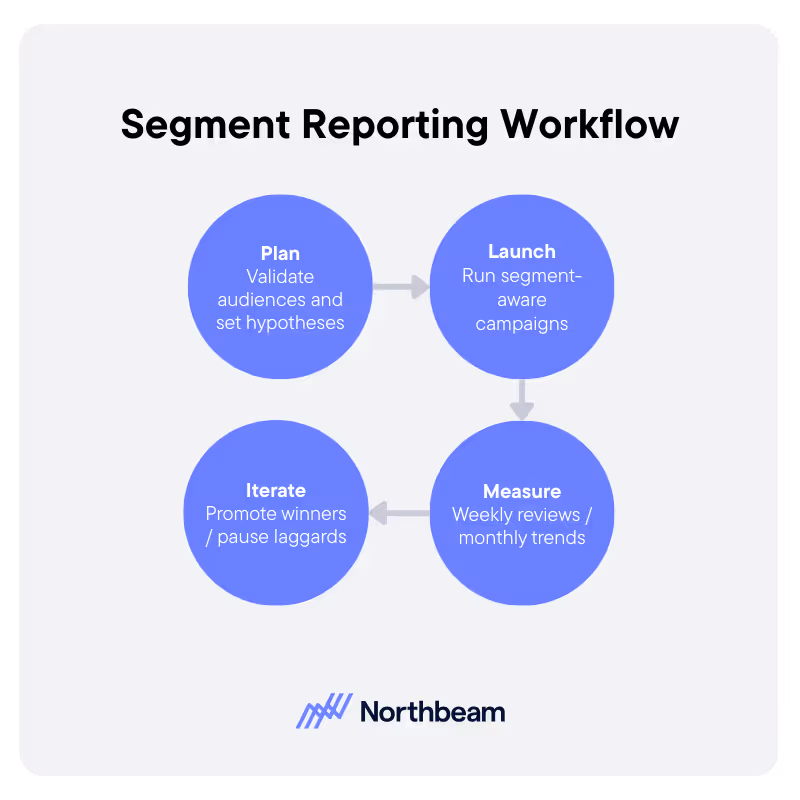
Workflow
- Plan: Validate audiences with Audience Insights and set hypotheses for top segments.
- Launch: Build campaigns with segment-aware ad sets and creative variants.
- Measure: Conduct weekly segment reviews and monthly trend analyses via dashboards or exports.
- Iterate: Promote winners, pause laggards, and adjust creative or landing pages for segment fit.
Governance
- Respect LinkedIn’s privacy thresholds and avoid micro-segmentation that produces unreliable data.
- Standardize definitions of key metrics (clicks, leads, pipeline stages) and attribution windows across marketing and sales teams to ensure consistency.
By combining clean data, disciplined audience design, and a structured workflow, segment reporting becomes a reliable engine for ongoing optimization rather than a one-off analysis.
Implementation Considerations
Even the best tools and workflows won’t deliver results without clear standards and disciplined execution.
To make segment reporting sustainable, marketers need shared definitions, a consistent cadence, and guardrails that keep analyses meaningful.
Shared Definitions
- Establish canonical lists for job functions, titles, and industries, with clear rules for how to roll up smaller cohorts.
- Standardize audience and campaign naming conventions, and keep version logs whenever targeting or creative changes occur.
Cadence
- Run weekly optimization cycles using segment-level reads.
- Conduct monthly or quarterly reviews of audience mix by market and vertical to spot broader trends.
KPIs by Goal
- Awareness: Reach, frequency, and qualified engagement rate by segment.
- Acquisition: CTR, CPL, conversion rate, and cost-per-qualified-lead by segment.
- Pipeline: Lead-to-opportunity rate and cost-per-opportunity by segment.
- Efficiency: Incremental lift after creative or offer changes, plus payback period trends.
Risk management
- Set guardrails for minimum audience sizes to avoid over-fragmentation and unreliable data.
- Account for seasonality and macro events when comparing month-over-month segment performance.
With disciplined definitions, cadence, and guardrails, segment reporting becomes a reliable source of insights and consistent performance gains.
Turning Insights Into Action
Segment reporting cuts through the noise of aggregate metrics to show which professional audiences (by title, seniority, industry, and beyond) are truly driving performance.
These insights aren’t just descriptive; they enable smarter targeting, sharper creative, and more efficient budget allocation across every stage of the funnel.
To make the most of LinkedIn’s ad reporting capabilities, keep it simple:
- Commit to a weekly routine. Review your top-performing segments, refresh one creative or targeting variable, and adjust budgets accordingly.
- Save a go-to Audience Insights view. For example, segment by job function and industry, and dedicate 20 minutes each week to check in on performance.
By treating segment reporting as an ongoing habit rather than a one-off analysis, you build a repeatable system for turning LinkedIn’s demographic depth into measurable growth.


.avif)


%25201.avif)


.avif)


.svg)
