Blog

Measuring Brand Performance: How to Track Awareness, Loyalty, & Perception

Connect Brand Health to Real Business Impact
Measuring Brand Performance How To Track Awareness Loyalty And Perception

TL;DR

  • Brand performance measures how well your brand is known, trusted, and preferred, and how those perceptions translate into real business outcomes.
  • The three core dimensions to track are awareness, perception, and loyalty or advocacy. Each requires different metrics and data sources.
  • Consistent measurement and analytics is critical to avoid vanity metrics and misleading signals.
  • When brand metrics are tied to outcomes like retention, CLV, and acquisition cost, they become a practical tool for optimizing spend and driving sustainable growth.

Brand performance is one of the most important drivers of long-term growth, yet it is often the least clearly measured.

This guide breaks down how to measure brand performance in a structured, practical way, covering the key metrics for awareness, perception, and loyalty, how to track them consistently, and how to connect brand health to real business outcomes like retention, customer lifetime value, and acquisition efficiency.

What Brand Performance Is & Why It Matters

Brand performance describes how well a brand is known, trusted, liked, and ultimately preferred in the market.

Strong brand performance does not live only in sentiment surveys or social buzz. It translates into tangible business outcomes like higher conversion rates over time, stronger retention, increased customer lifetime value, and the ability to command premium pricing.

But for many marketing teams, brand is still treated as a “top-of-funnel” concept. Awareness campaigns run, impressions are counted, and success is often measured in reach alone.

But value compounds. A customer who recognizes and trusts a brand is more likely to choose it repeatedly, forgive small missteps, and recommend it to others.

Without a way to measure these effects, brand investment can feel hard to defend, especially when compared to channels with immediate, trackable conversions.

Measuring brand performance gives marketers a way to quantify long-term impact, justify brand spend, optimize creative and channel mix, and connect brand activity to downstream business results.

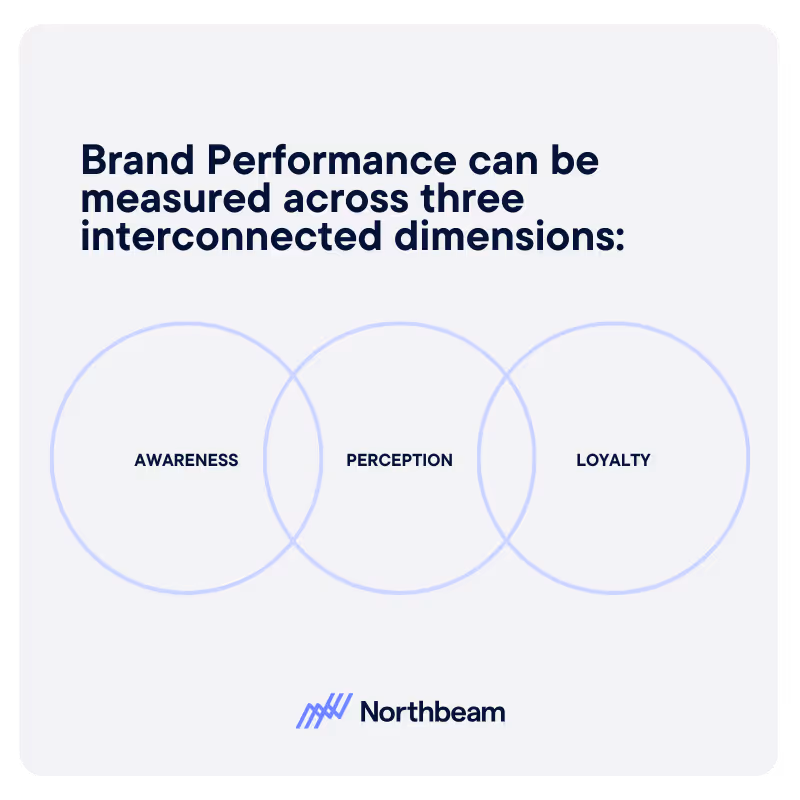
Brand performance can be measured across three connected dimensions:

  • Awareness, which measures how many people know or recognize your brand and whether it enters their consideration set.
  • Perception, which reflects how people feel about your brand, including trust, quality, and the associations they hold.
  • Loyalty and advocacy, which show whether those perceptions convert into repeat purchases, recommendations, and long-term relationships.

Together, these dimensions provide a structured way to track brand health beyond sales, as well as its role in driving sustainable growth.

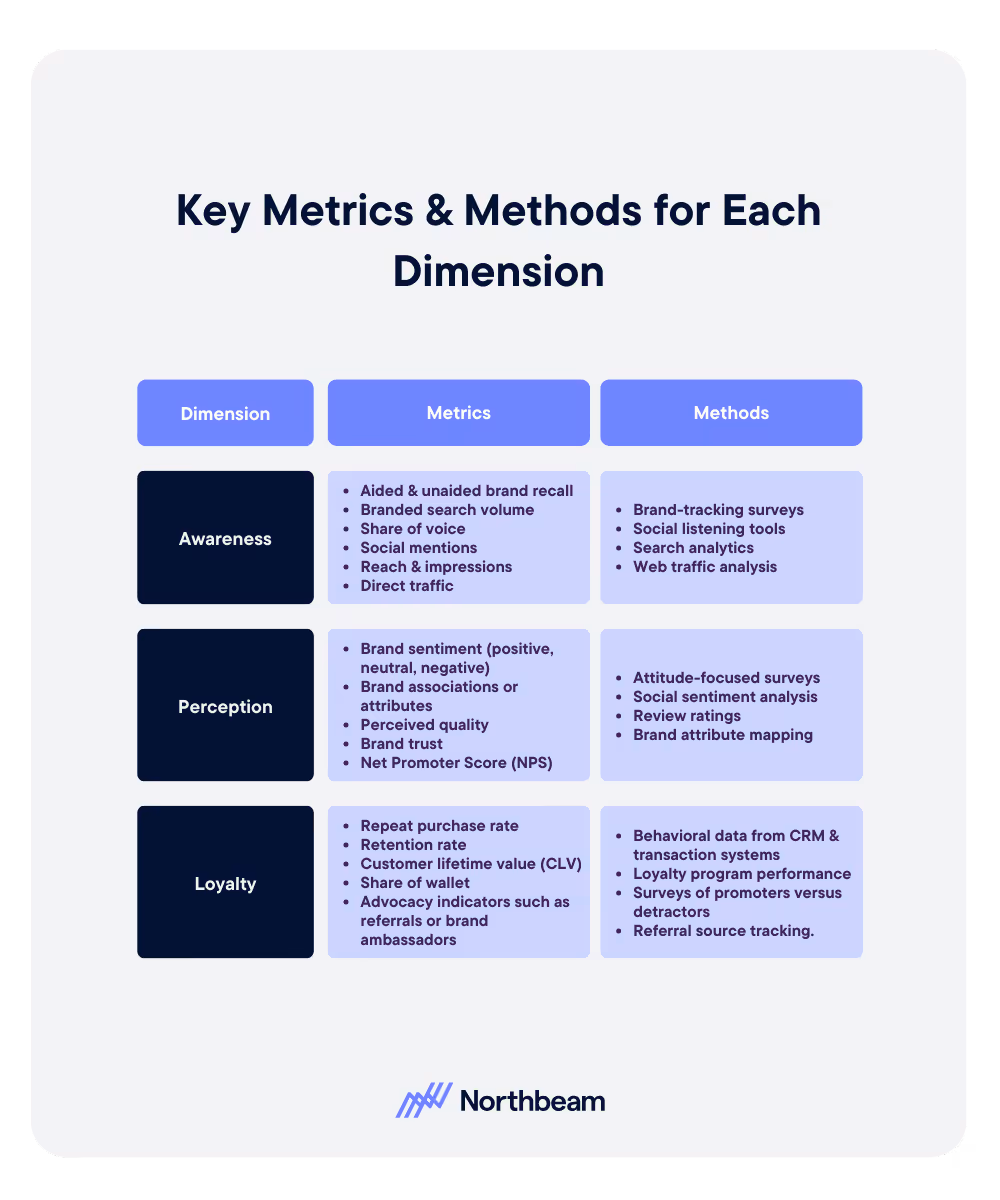
Key Metrics & Methods for Each Dimension

Brand performance emerges from a set of complementary signals that, together, show how visible your brand is, how it is perceived, and whether those perceptions translate into real customer behavior.

Brand Awareness Metrics

  • Metrics:  
    • Aided and unaided brand recall
    • Branded search volume
    • Share of voice
    • Social mentions
    • Reach and impressions
    • Direct traffic
  • Methods:  
    • Brand-tracking surveys
    • Social listening tools
    • Search analytics
    • Web traffic analysis
  • Example indicators:
    • “What brands come to mind when you think of X?” (unaided recall)
    • “Which of the following brands have you heard of?” (aided recall)
  • What this reveals:
    • Whether your brand is entering the consideration set
    • How visible it is compared to competitors
    • How strong or consistent your presence is in the market over time

Perception & Brand Health Metrics

  • Metrics:
    • Brand sentiment (positive, neutral, negative)
    • Brand associations or attributes
    • Perceived quality
    • Brand trust
    • Net Promoter Score (NPS)
  • Methods:
    • Attitude-focused surveys
    • Social sentiment analysis
    • Review ratings
    • Brand attribute mapping
  • Example indicator:
    • NPS asks, “On a scale from 0 to 10, how likely are you to recommend our brand to a friend?”
  • What this reveals:
    • Whether consumer perceptions align with your intended brand position
    • Where gaps exist between how you want to be seen and how you are actually experienced

Loyalty, Retention & Advocacy Metrics

  • Metrics:
    • Repeat purchase rate
    • Retention rate
    • Customer lifetime value (CLV)
    • Share of wallet
    • Advocacy indicators such as referrals or brand ambassadors
  • Methods:
    • Behavioral data from CRM and transaction systems
    • Loyalty program performance
    • Surveys of promoters versus detractors
    • Referral source tracking.
  • What this reveals:
    • How your brand’s awareness and perception translate into tangible outcomes like sustained relationships, higher spend, and organic growth through recommendation.

Building a Brand Performance Tracking Framework

Measuring brand performance is most effective when it follows a clear, repeatable framework.

Step 1: Define Brand Goals & Competitive Position

Start by clarifying what success looks like for your brand.

This might mean increasing unaided awareness, becoming the most trusted option in your category, or improving brand loyalty measurement and metrics among a specific audience segment.

Clear goals ensure your measurement strategy is purposeful, not generic.

Step 2: Select Metrics Aligned to Those Goals

Choose metrics that directly reflect your objectives.

For example, if trust is a priority, brand trust scores, sentiment, and NPS should take precedence over reach or impressions.

Avoid tracking everything and focus on the signals that matter most.

Step 3: Establish Baselines & Benchmarks

Before making changes, understand where you are today. Run surveys, analyze historical data, and gather competitive or industry benchmarks where possible.

Baselines allow you to measure progress and avoid misinterpreting short-term fluctuations.

Step 4: Set Up Data Collection Systems

Ensure you have reliable processes in place to collect data consistently. This often includes brand-tracking surveys, social listening tools, web and search analytics, and CRM integrations.

Consistency is key for trend analysis.

Step 5: Connect Brand Metrics to Business Outcomes

Link brand metrics to outcomes like sales growth, retention improvements, margin lift, or changes in acquisition cost. This connection is what turns brand measurement into a decision-making tool.

Step 6: Dashboard, Review, and Iterate

Create dashboards that show awareness, brand perception tracking, and loyalty metrics alongside business KPIs. Review them on a regular cadence and use insights to adjust creative, spend, and channel mix over time.

Attribution & Time-Horizon Considerations

Brand performance requires a different approach to attribution than direct-response marketing. Both the timing of impact and the number of contributing touchpoints make brand effects harder to isolate, but not impossible to measure.

Here’s what to keep in mind:

Brand Impact Takes Longer to Materialize

Brand metrics tend to move on a longer time horizon than clicks or conversions.

Awareness lifts, perception shifts, and trust gains often appear weeks or months before they influence purchase behavior, retention, or lifetime value.

This lag means brand impact can be underestimated if it is evaluated using short reporting windows or last-touch logic.

Attribution Is Inherently Multi-Touch

Brand performance is shaped by many touchpoints working together, including paid media, PR, social content, organic exposure, word-of-mouth, and product experience.

Because influence is distributed, brand metrics cannot be attributed as precisely as direct-response channels. That said, they still merit structured attribution modeling focused on incrementality rather than perfect precision.

Use Hybrid Attribution Approaches

A practical solution is hybrid attribution. This approach links changes in brand metrics, such as improvements in recall, trust, or sentiment, to subsequent lifts in behavioral outcomes like conversion rate, repeat purchase, or retention.

Techniques such as uplift tests, geographic or audience hold-out groups, and pre- and post-campaign analysis help isolate the incremental impact of brand activity.

Measure Consistently to Prove Incremental Value

Ongoing measurement is critical. One-off studies can show correlation, but only consistent tracking reveals whether brand-driven changes create sustained value.

Regular brand measurement allows teams to separate true impact from short-term noise or external events and make more confident, data-informed decisions about brand investment over time.

Common Pitfalls With Brand Measurement

Even well-intentioned brand measurement efforts can fall short if they focus on the wrong signals or lack consistency.

The pitfalls below can undermine the value of brand performance tracking if left unaddressed:

Chasing Vanity Metrics

Metrics like follower counts, likes, or mentions can look impressive but often lack strategic meaning.

Without a clear connection to brand goals or business outcomes, vanity metrics offer little guidance for optimization or decision-making.

Ignoring Context and External Factors

Not every spike in branded search or direct traffic reflects improving brand health. Short-term campaigns, press coverage, or external events can temporarily inflate metrics. Without context and trend analysis, teams risk overestimating the impact of brand activity.

Assuming Awareness Equals Sales

Increases in awareness do not automatically lead to revenue. If perception is weak or trust is low, awareness may fail to convert. Sustainable growth requires alignment across awareness, perception, and loyalty, not progress in one dimension alone.

Inconsistent Measurement Over Time

Changing survey questions, methodologies, or data sources mid-stream makes it difficult to compare results over time. Consistency is essential for identifying real trends and understanding long-term brand impact.

Siloed Brand Data

When brand tracking lives outside the broader analytics and attribution stack, insights are rarely acted on. Integrating brand metrics with performance data ensures brand insights inform campaign planning, optimization, and budget allocation.

From Brand Lift to Business Impact: A Practical Example

A mid-sized consumer brand set out to better understand whether its brand investments were driving real business value.

Rather than tracking awareness alone, the team focused on three core metrics:

  • Unaided brand recall
  • Brand sentiment
  • Repeat purchase rate.

After launching a new emotional brand campaign, the brand tracked performance over six months. During that time:

  • Unaided recall increased from 22% to 30%
  • Overall brand sentiment improved by 12%
  • Repeat purchase rate rose by 8%

These changes were not viewed in isolation. The team linked improvements in recall and sentiment to downstream outcomes, including higher customer lifetime value and a lower cost of acquisition.

To measure brand awareness and loyalty perception, among other metrics, the brand combined quarterly online brand-tracking surveys, a social listening tool to measure sentiment, and CRM data to track repeat purchases. They then ran a cohort analysis comparing customers who recalled the brand to those who did not.

Customers with brand recall showed higher repeat purchase rates and stronger long-term value, helping establish a clearer link between brand perception and behavior.

These insights directly informed budgeting decisions. The brand increased investment in brand-led channels such as video and PR while keeping direct-response spend stable.

Ongoing monitoring of loyalty and retention metrics allowed the team to justify the shift and continue optimizing their brand strategy based on measurable impact.

Turning Brand Measurement into Action

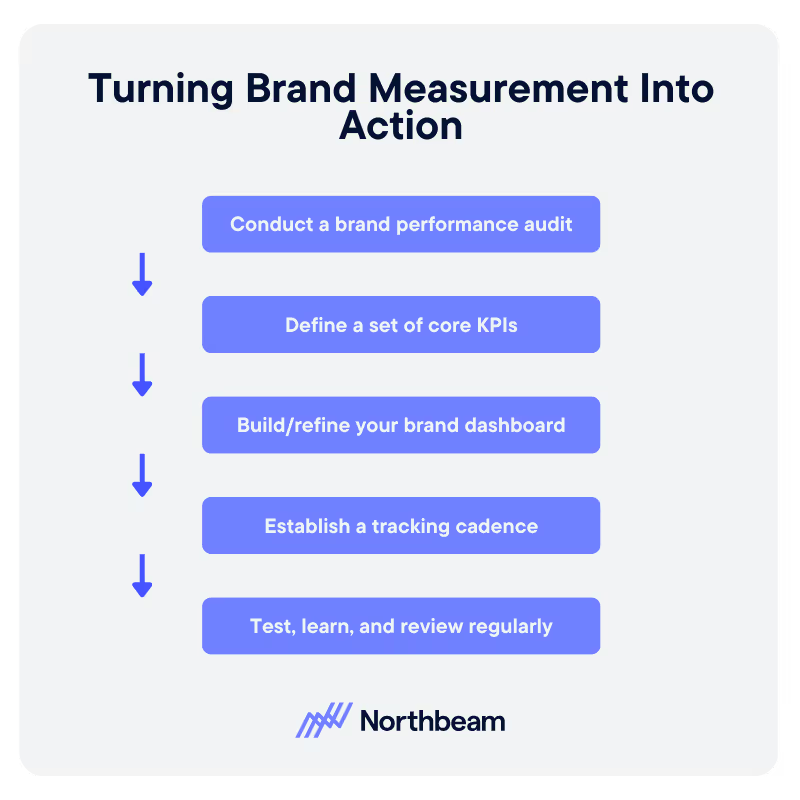
Brand performance KPIs for marketers in 2025 only create value when insights are actively used. The steps below help teams move from tracking metrics to making better strategic and budget decisions.

Conduct a Brand Performance Audit

Start by listing all the brand-related metrics you currently track across awareness, perception, and loyalty. Identify where data is missing, inconsistent, or disconnected from business outcomes.

This audit clarifies what you truly understand about your brand today.

Define a Small Set of Core Brand KPIs

Select three to five brand KPIs that align directly with your strategic goal. For example, this might include unaided brand recall, Net Promoter Score, and repeat purchase rate.

Set clear targets for the next twelve months so progress can be measured consistently.

Build or Refine Your Brand Dashboard

Create a dashboard that brings brand metrics and business KPIs together. Include baselines, targets, and trends over time, as well as segmentation by audience cohort or geography where relevant.

Most importantly, show how brand movement connects to outcomes like retention, conversion, or acquisition cost.

Establish a Clear Tracking Cadence

Consistency matters more than frequency. Set a regular schedule, such as quarterly brand surveys, weekly social listening, and monthly repeat purchase analysis.

A defined cadence makes it easier to spot trends and avoid overreacting to short-term noise.

Test, Learn, and Review Regularly

Use test and hold-out approaches for brand campaigns by exposing one audience to brand activity and comparing results against a control group.

Review brand metrics alongside performance and attribution KPIs in your regular strategy meetings so brand insights directly inform campaign planning and investment decisions.

Measuring What Makes Brands Last

Brand performance is about understanding how awareness, perception, and loyalty work together to create durable business value over time.

When brand metrics are defined clearly, measured consistently, and connected to real outcomes like retention, lifetime value, and acquisition efficiency, they become powerful decision-making tools.

With effective brand measurement, teams can justify brand investment, optimize creative and channel mix, and move beyond short-term thinking toward sustainable growth.

Continue Reading

Ad Operations 101: How Digital Ads Get Delivered

Ad Operations 101: How Digital Ads Get Delivered

Ad Ops Systems, Workflows, and Delivery Mechanics
How to Build a Customer Acquisition Funnel (Step-by-Step Guide)

How to Build a Customer Acquisition Funnel (Step-by-Step Guide)

Designing, Measure, and Optimize Customer Acquisition
Mid-Funnel Strategies: Nurturing Prospects from Consideration to Intent

Mid-Funnel Strategies: Nurturing Prospects from Consideration to Intent

Don’t Lose Momentum Mid-Funnel
Points of Parity vs. Points of Difference: Finding Your Brand’s Competitive Sweet Spot

Points of Parity vs. Points of Difference: Finding Your Brand’s Competitive Sweet Spot

Meet Category Expectations While Standing Out in Meaningful Ways
performance-marketing-channels-guide-to-ppc-affiliates Performance marketing Channels A Guide To PPC Affiliates And More

Performance Marketing Channels: A Guide to PPC, Affiliates, & More

Your end-to-end playbook for selecting the right performance channels
What Is the Meta Conversions API? Implementing Server-Side Tracking in a Privacy-First World

What Is the Meta Conversions API? Implementing Server-Side Tracking in a Privacy-First World

Pair Pixel with CAPI for Accurate Measurements
Gamification Marketing: Using Game Mechanics To Boost Ad Engagement & Attribution

Gamification Marketing: Using Game Mechanics to Boost Ad Engagement & Attribution

How can gamification help your marketing ads and attribution?
LinkedIn Segment Reporting How To Analyze Your Ad Audiences

LinkedIn Segment Reporting: How to Analyze Your Ad Audiences on LinkedIn

Use LinkedIn for Smarter Targeting, Creative, and Budget Decisions
Cyber Week 2025 A Data Driven Look At Performance And Strategy

Cyber Week 2025: A Data‑Driven Look at Performance and Strategy

A data-driven look at how DTC brands actually performed during Cyber Week 2025, and why you should adjust your channel mix, pacing, and benchmarks before next year.
Second Party Data Tapping Into Trusted Partner Data For Marketing

Second-Party Data: Tapping Into Trusted Partner Data for Marketing

A Practical Guide to Partner-Sourced Data
Is Your Company Data Mature Understanding Data Maturity Models For Marketing

Is Your Company Data-Mature? Understanding Data Maturity Models for Marketing

Is Your Team Really “Data Driven?”
Introducing Incrementality By Northbeam: Automated Lift Testing You Can Trust

Introducing Incrementality by Northbeam: Automated Lift Testing You Can Trust

Run incrementality tests end-to-end inside Northbeam—automated design, rigorous validation, and unified results alongside your MTA and MMM for confident, daily decision-making.
Reporting on Marketing Automation Performance: Proving the ROI of Your Drip Campaigns

Reporting on Marketing Automation Performance: Proving the ROI of Your Drip Campaigns

Measure, Attribute, and Prove Business Value
Marketing Funnel Automation Scaling Engagement On Autopilot

Marketing Funnel Automation: Scaling Engagement on Autopilot

Build, Automate, and Measure
Why New Customer ROAS Matters More Than Blended Metrics

Why New Customer ROAS Matters More Than Blended Metrics

Why optimizing to New Customer ROAS (nROAS) — not blended ROAS — is the only way to scale net‑new growth, with a simple daily workflow to make it operational.
Channel Strategy How To Choose The Right Marketing Channels For Your Business

Channel Strategy: How to Choose the Right Marketing Channels for Your Business

Evaluate, Test, and Optimize Your Marketing Channels
Ad Fatigue In Digital Marketing How To Recognize And Remedy It

Ad Fatigue in Digital Marketing: How to Recognize & Remedy It

How to Know When Your Audience Has Seen Enough
Churn Analysis Identifying Why Customers Leave And How To Win Them Back

Churn Analysis: Identifying Why Customers Leave (And How to Win Them Back)

Uncover Churn Drivers and Build Stronger Retention Strategies
Funnel Creation Made Simple How To Map Out Your Marketing Funnel

Funnel Creation Made Simple: How to Map Out Your Marketing Funnel

Map, Measure, and Optimize the Customer Journey
Kill Last Click Bias A Simple Playbook For Read During BFCM

Kill Last‑Click Bias: A Simple Playbook for Reads During BFCM

A practical, windowed-read playbook—short for capture, longer for prospecting—to avoid last‑click bias during Cyber Five.
The Cyber Five Pattern What To Expect Heading Into BFCM

The Cyber Five Pattern: What to expect Heading Into BFCM

Planning Cyber Five with pattern‑based pacing and clear measurement reads.
What Is MAU Tracking Monthly Active Users To Gauge Growth

What Is MAU? Tracking Monthly Active Users to Gauge Growth

Learn what Monthly Active Users (MAU) means, how to measure it accurately, and how to use MAU trends to improve product engagement, retention, and growth.
User Segmentation Strategies How To Personalize Marketing For Every Audience

User Segmentation Strategies: How to Personalize Marketing for Every Audience

Learn how to build and activate user segments that power personalized marketing, boost engagement, and drive long-term customer loyalty.
Which Campaigns Benefit Most From CDV

Which Campaigns Benefit Most from C+DV? Prospecting, Reach/Traffic, and Retention by the Numbers

Learning How C+DV Evens the Playing Field
Fogg Behavior Model: Motivation, Ability, and Prompts

Fogg Behavior Model: Motivation, Ability, and Prompts

Apply Behavior Design Principles to Your Marketing Strategy
Lifecycle Marketing 101 For Every Stage Of The Customer Journey

Lifecycle Marketing 101: Engaging Customers at Every Stage of the Journey

Build Customer Relationships That Last

Benchmarks & Stoplights: Turning Data Into Daily Decisions for Ad Optimization

Turn your best performance days into a live decision system with clear green, yellow, and red signals—so your team knows exactly when to scale, pause, or pivot.
Behavioral Data In Marketing How User Behavior Drives Growth

Behavioral Data In Marketing: How User Behavior Drives Growth

Optimize journeys and personalize experiences
Cohort Analysis For Marketers Uncovering Trends In Customer Behavior

Cohort Analysis for Marketers: Uncovering Trends In Customer Behavior

Learn how to use cohort analysis to track retention, forecast LTV, and drive sustainable growth.
User Stickiness How To Measure Customer Engagement Metric

User Stickiness: The Metric to Measure Customer Engagement (and How to Improve It)

Discover how to calculate and improve user stickiness (DAU/MAU) — the key metric for measuring customer engagement and loyalty.

The PESO Model: Integrating Paid, Earned, Shared, and Owned Media

Learn how the PESO model unifies Paid, Earned, Shared, and Owned media into one powerful strategy.
reasons your awarness campaigns arent driving revenue

7 Reasons Your Awareness Campaigns Aren’t Driving Revenue

How evolving attribution models, creative strategy, and platform dynamics are redefining top-of-funnel success this BFCM season.

How Omnilux Drove a 659% ROAS Lift on Pinterest with Northbeam’s Clicks + Deterministic Views

A case study with Northbeam's newest attribution model.
Clicks + Deterministic Views, by Northbeam.

Introducing Clicks + Deterministic Views by Northbeam

A revolutionary new viewthrough model, now available in Northbeam.

Contextual Targeting In Advertising: Reaching Audiences Without Cookies

Discover how contextual targeting delivers privacy-first, high-performing ads without cookies.

First vs Second vs Third-Party Data: What Are They and Why They Matter

Learn the differences between first-, second-, and third-party data.

Zero-Party Data: The New Gold Standard in Privacy-First Marketing

Learn best practices for collection, activation, and governance to drive trust and ROI.
The Explore Exploit Cycle Of Meta's Algorithm

The Explore–Exploit Cycle of Meta’s Algorithm

Why Meta’s algorithm makes performance swing — and how to ride the cycle instead of panicking through the dips.
what-is-gclid-complete-guide-to-google-click-identifier

What Is GCLID? Complete Guide to Google Click Identifier

Learn what GCLID is, how it works, and why it’s essential for accurate Google Ads tracking.
beyond roas fundamentals of advertising hero

Beyond ROAS: Fundamentals of Advertising In 2025

Why relying on ROAS alone can stunt growth—and the metrics that reveal if your ads are truly building a brand.

iOS 26 Won’t Kill Your UTMs – Here’s Proof

Despite headlines warning of doom, our testing shows iOS 26 leaves Northbeam’s UTMs untouched.
what-is-fcblid-guide-to-facebook-click-identifiers-and-tracking-ad-performance

What is fbclid? A Complete Guide to Facebook Click Identifiers and Tracking Ad Performance

This small URL parameter powers big improvements in Meta ad attribution

What Is Data-Driven Marketing? A Complete Guide to Transforming Your Marketing Strategy with Data

Leverage data to improve your marketing strategies

Why You Should Care About MTA, MMM, and Incrementality

Transform Your Marketing Performance
A futuristic cityscape with a glowing digital figure and a person studying analytics, symbolizing insights into Return on Ad Spend and mastering return on ad spend, with the Northbeam logo and text overlay.

What Is ROAS? A Beginner’s Guide to Return on Ad Spend

Learn why ROAS matters and how to maximize your returns
What makes Northbeam data different

What Makes Northbeam Data Different?

Not All Data is Created Equally

What to Expect When Switching to Northbeam

Everything You Need to Know When You Try Out Northbeam
Illustration of pixel tracking concept with magnifying glass over mechanical gears, symbolizing data analysis, and Northbeam logo in the top corner. Text reads: 'What is Pixel Tracking?

What is Pixel Tracking?

Unlock the Power of Pixel Tracking for Better Marketing Insights
What is Multi-Touch Attribution (MTA)?

Multi-Touch Attribution Models: A Complete Guide to Measuring Every Marketing Touchpoint

Understand, compare, and implement MTA for smarter marketing measurement

What is Media Mix Modeling (MMM)?

Wondering what exactly comprises Media Mix Modeling? Get a comprehensive overview of MMM

What is Marketing ROI and How Can You Improve It?

Understand and enhance your marketing ROI
Image of a man utilizing applovin on his phone and measuring the impact of his adds using Northbeam, the multi touch attribution solution for profitable growth

What is AppLovin and How to Leverage it For Marketing Success

Why DTC brands are flocking to AppLovin, and how to make it work for you

What is Marketing Intelligence Software?

Capture the right data for informed marketing decisions
This highlights key marketing metrics with a creative scene of a strategist building a futuristic ship, symbolizing innovation and long-term success strategies, with the Northbeam logo and text overlay.

Top Marketing Metrics to Track for Long-Term Success

Track these essential metrics to drive sustainable growth

What Is Incrementality In Marketing? A Guide to Measuring True Campaign Impact

The Critical Role of Attribution Models in Unlocking Growth
Northbeam presents a marketer’s guide to customer journey mapping, featuring a relaxed professional at a desk, symbolizing strategic planning and marketing success.

The Marketer’s Guide to Customer Journey Mapping

Turn messy customer paths into data-driven strategies for growth

The Future with YouTube Advertising

Navigating rising digital ad costs with Northbeam

The Marketer’s Guide to AI

How modern marketers can best harness the power of AI
Super Bowl Football Field with the Super Bowl logo and Northbeam logo sitting on the 50 yard line

Super Bowl 2025 Advertising Trends & Performance Analysis

The Big Game, Big Spends, and Even Bigger Marketing Moves

Performance Benchmarks: Black Friday Cyber Monday 2023

A look into this year's performance compared to last year.

Serious Data For Serious Growth: How Northbeam Enables HexClad To Stay Efficient with Scale

Leveraging Northbeam for scalable efficiency

The 2024 Guide to Incrementality

A guide to measuring marketing impact

Northbeam's Definitive Guide to Q5 2025

A Northbeam guide to the "hidden" fifth quarter
Abstract illustration showcasing individuals standing on interconnected platforms with glowing gears, representing probabilistic and deterministic approaches in a cookieless future, with the Northbeam logo and text overlay.

Probabilistic vs. Deterministic Attribution Approaches In a Cookieless Future

Combine probabilistic and deterministic models for future-proof attribution

How Will Cookie Deprecation Affect Northbeam? An Explainer

Northbeam's resilience amid third-party cookie deprecation
Northbeam showcases a futuristic city with holographic figures, drones, and digital interfaces, guiding ecommerce brands on Meta's new sensitivity category restrictions.

Meta’s Sensitivity Category Restrictions: A Guide for Ecommerce Brands

How to get to grips with Meta's privacy restrictions

Beyond Walled Gardens: How Marketers Can Thrive in a Fragmented Digital Landscape

Embrace open web strategies in the evolving digital ad landscape
How to Not Get Fired: A 5-Step Guide for CMOs

How To Not Get Fired: A 5-Step Guide for CMOs

Secure your role amid a shifting marketing landscape

Media Mix Modeling (MMM): Build or Buy?

Evaluating the best approach to implementing MMM

Marketing Efficiency Ratio (MER): Definition, Benchmarks, and How it Differs from ROAS

Use MER and ROAS Together for Smarter Decisions
Northbeam is powered by AI, and so will you.

How does Northbeam use AI?

Northbeam's advanced ML models enhance marketing performance
Cost per clicks

Do Cost Per Clicks Matter?

Evaluating the significance of CPC in performance marketing

Google Chrome Won’t be Deprecating Cookies — Yet

Google's decision to retain third-party cookies, and what it means for you
Utm Tracking 101 How To Use Utm Parameters To Measure Campaigns

UTM Tracking 101: How to Use UTM Parameters to Measure and Improve Campaign Performance

Learn how to use UTM parameters to track campaign performance, improve attribution, and optimize ROI with this step-by-step guide for marketers.
Northbeam presents Black Friday and Cyber Monday 2024 predictions and performance with a futuristic digital sphere, symbolizing data-driven insights and analysis.

BFCM 2024 Predictions: How Did We Do?

Wins, surprises, and lessons for 2025
Northbeam presents a seamless omnichannel marketing strategy with a historical meeting room and futuristic digital elements, symbolizing innovation and best practices.

Creating a Seamless Omnichannel Marketing Strategy: Tips & Best Practices

Mastering Omnichannel Marketing by creating a Seamless, Data-Driven Customer Journey
Northbeam highlights customer retention with an elegant historical setting, symbolizing long-term relationships and why retention should be every marketer’s priority.

Beyond Acquisition: Why Retention Should Be Every Marketer’s Priority

Shifting Focus: Why Retention Is the Key to Sustainable Growth and Profitability
Company Northbeam creates an ad spend optimization with a vintage airplane in a high-tech workshop, symbolizing innovation and maximizing Return on Investment from every marketing dollar.

Ad Spend Optimization: How to Get More ROI from Every Marketing Dollar

Stop Wasting Ad Spend: How Smarter Strategies and Tools Can Maximize ROI
Futuristic laboratory scene with advanced technology screens, DNA graphics, and a scientist analyzing data, representing innovation strategies for return on investment with Northbeam during economic uncertainty, with the Northbeam logo and text overlay.

5 Strategies to Maximize ROI During Economic Uncertainty

Use data-driven techniques to thrive during challenging times
a vibrant digital marketing control room with gears, graphs, and data screens, illustrating insights from a beginner's guide to marketing attribution, with a Northbeam logo and overlay.

A Beginner’s Guide to Marketing Attribution: Understanding the Fundamentals

Learn what marketing attribution is and how to harness its power in an ever-changing digital landscape
Northbeam is the perfect tool for performance marketing agencies.

5 Reasons Why Northbeam is the Perfect Tool for Performance Marketing Agencies

The Last Thing You Should Worry About Is Accurate Data

Accounting Modes 101: What Marketers Need to Know

Understanding cash snapshot and accrual performance modes

2025 Marketing Trends to Watch Out For: Part 2

CTV growth, evolving search, nano-influencers, and data privacy

2025 Marketing Trends to Watch Out For: Part 1

Navigating a Shifting Landscape of Generative AI, Social Media, and Data Privacy

It's time to take your marketing

to the next level.

Chat with our team and discover how Northbeam can transform your business.
book a demo