


CPM is one of the most widely used advertising metrics, yet many marketers either calculate it incorrectly or interpret it in isolation.
CPM, or cost per thousand impressions, measures the price you pay for exposure, not actual performance.
In this guide, we’ll break down the CPM formula step by step, walk through practical calculation examples, highlight common mistakes, compare CPM across channels, and show how to use a CPM calculator effectively.
Though not a performance verdict, when used properly, CPM is a powerful pricing and efficiency signal.
What Is CPM and Why Does it Matter
CPM stands for cost per mille, with mille meaning one thousand. In advertising, CPM measures how much you pay for 1,000 impressions. An impression in this context is simply a single ad view. The formula standardizes pricing across campaigns of different sizes, making it easier to compare exposure costs.
CPM is most commonly used in display advertising, paid social, video campaigns, and programmatic media buying. These channels are often optimized around reach and visibility, especially in top-of-funnel campaigns where the goal is awareness rather than immediate conversion.
Buying on CPM differs from buying on CPC, cost per click, or CPA, cost per acquisition. With CPC and CPA, you pay for actions. With CPM, you pay for exposure, regardless of whether someone clicks or converts.
That distinction matters. CPM is a pricing metric, not a performance metric. It tells you how expensive attention is, not how valuable that attention becomes.
CPM is the right metric to focus on when your objective is reach, brand awareness, audience testing, or forecasting budget requirements. It becomes less useful when evaluating efficiency deeper in the funnel, where engagement and revenue matter more than impressions alone.
The CPM Formula Explained Step by Step

The core CPM formula is: CPM = (Total Cost ÷ Total Impressions) × 1,000
Example: If you spend $500 and get 80,000 impressions, CPM = (500 ÷ 80,000) × 1,000 = $6.25.
Here’s what each piece means:
- Total Cost: What you spent to run the ads. Use actual spend for the time period you are analyzing (not the planned budget).
- Total Impressions: The number of times your ad was served and recorded as an impression by the platform.
- × 1,000: Converts the cost per single impression into cost per thousand impressions.
Best practices:
- If you are working with partial campaign data, keep the inputs aligned. For example, if you are looking at the first 7 days of a 30-day campaign, use spend and impressions from those same 7 days only. Mixing full budget with partial delivery is an easy way to get nonsense CPMs.
- For blended campaigns across channels, calculate CPM per advertising channel first, then compute a blended CPM using total spend and total impressions across all included channels. Avoid averaging CPMs directly; that can overweight small campaigns.
Common mistakes include:
- Using clicks instead of impressions
- Mixing currencies
- Mixing time windows
- Rounding errors
Practical CPM Examples Across Channels
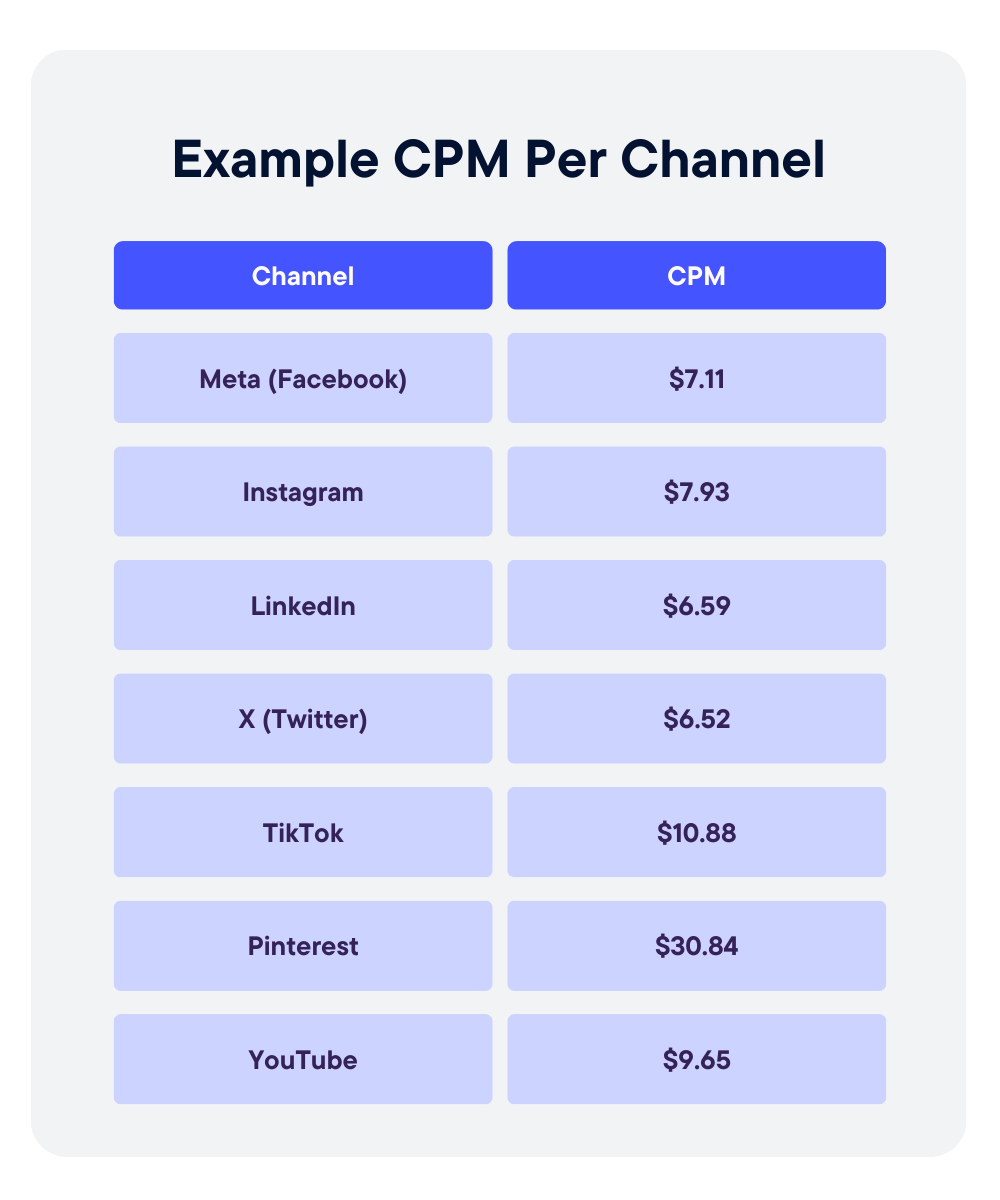
CPM varies widely by channel, audience, and objective, so context matters more than the raw number.
Display Advertising Example
A brand runs banner ads on a news site, spending $2,000 for 400,000 impressions. CPM = (2,000 ÷ 400,000) × 1,000 = $5.00.
Display campaigns often have lower CPMs because inventory is abundant and reach is broad. A $5 CPM may be efficient for awareness, but it says nothing about engagement quality or conversion performance.
Paid Social Example
A paid social campaign spends $1,500 and delivers 120,000 impressions. CPM = (1,500 ÷ 120,000) × 1,000 = $12.50.
Social CPMs are typically higher than standard display because of tighter audience targeting and auction dynamics. A higher CPM here may reflect better segmentation rather than inefficiency.
Video Campaign Example
A video campaign spends $3,000 for 150,000 impressions. CPM = (3,000 ÷ 150,000) × 1,000 = $20.00.
Video inventory often commands higher CPMs due to format, attention time, and placement quality.
Blended Channel Example
If total spend across channels is $6,500 and total impressions are 670,000, blended CPM = (6,500 ÷ 670,000) × 1,000 ≈ $9.70.
Avoid averaging channel CPMs directly. Always recompute using total spend and total impressions.
Interpreting High vs Low CPM
A low CPM can signal cheap reach, but not necessarily effective reach. A higher CPM may indicate premium placements, narrower targeting, or stronger audience intent.
The question is not whether CPM is high or low. It is whether it aligns with your campaign objective and downstream performance.
What CPM Does Not Tell You
CPM is useful for understanding exposure costs, but it leaves out critical performance context.
CPM vs Engagement Quality
A low CPM does not mean people are paying attention. You can buy millions of impressions cheaply, but if users scroll past instantly, the value of that exposure is limited. CPM measures delivery, not attention depth or interaction quality.
CPM vs Conversion Rate
CPM does not reflect whether impressions lead to clicks, sign-ups, or purchases. Two campaigns can have identical CPMs but dramatically different conversion rates. Without downstream metrics, CPM alone cannot tell you which campaign is actually working.
CPM Inflation Due to Audience Narrowing
As you narrow targeting, CPM often rises. Smaller audiences increase auction competition and reduce available inventory. A higher CPM in this case may reflect precision, not inefficiency.
Vanity Efficiency Traps
Optimizing solely for the lowest CPM can create misleading wins. Cheap impressions can come from low-quality placements or poorly matched audiences. The metric may look efficient while business outcomes decline.
When to Prioritize Downstream Metrics Instead
When your objective is leads, revenue, or return on ad spend, metrics like cost per acquisition, conversion rate, and revenue per thousand impressions should carry more weight. CPM belongs at the top of the funnel, not as the final measure of success.
How to Use CPM in Strategic Planning
CPM becomes most valuable when used as a forecasting and planning input, not just a reporting metric.
Budget Forecasting Using CPM
Because CPM standardizes cost per 1,000 impressions, it allows you to reverse engineer budget requirements.
If your historical CPM is $10 and you want 1 million impressions, you can estimate spend at roughly $10,000. This makes CPM a practical starting point for media planning conversations.
Estimating Reach Based on Projected CPM
You can also work backward from budget. If you have $25,000 to spend and expect a $12 CPM, projected impressions = (25,000 ÷ 12) × 1,000 ≈ 2.08 million impressions. This helps set realistic expectations for reach before campaigns launch.
Comparing Channel Cost Structures
CPM allows apples-to-apples comparison across channels. Display may average $5 to $8, paid social $10 to $15, and premium video $20 or higher. These differences reflect format, targeting precision, and auction dynamics. Comparing CPMs helps clarify where exposure is most affordable.
Monitoring CPM Volatility Over Time
CPMs fluctuate due to seasonality, competition, creative fatigue, and audience saturation. Tracking CPM trends by week or month helps identify inflation, inventory pressure, or performance shifts that require adjustment.
Aligning CPM Targets With Campaign Objectives
Not every campaign needs the lowest possible CPM. Awareness campaigns may prioritize scale, while highly targeted campaigns may accept higher CPMs in exchange for relevance. Strategic planning means setting CPM expectations that match the objective, not optimizing blindly for the cheapest impressions.
CPM Measurement & Governance
CPM should never live alone on a dashboard. To use it responsibly, you need supporting metrics, diagnostic checks, and clear reporting standards.
KPIs to Monitor Alongside CPM
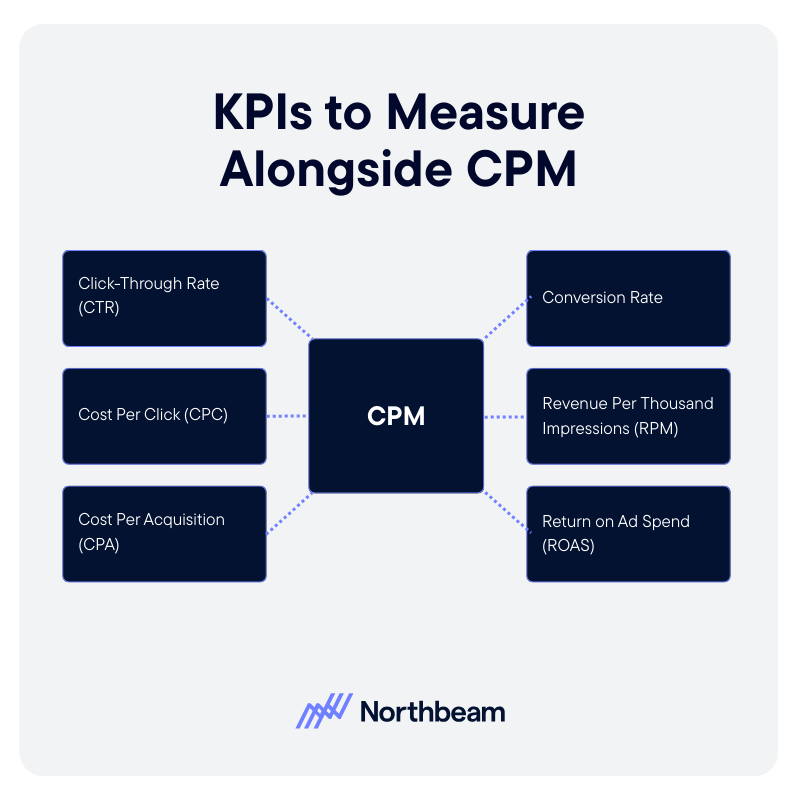
- Click-Through Rate (CTR): Helps determine whether impressions are driving engagement.
- Cost Per Click (CPC): Reveals whether a low CPM is translating into efficient traffic.
- Cost Per Acquisition (CPA): Connects exposure costs to actual business outcomes.
- Conversion Rate: Shows whether traffic generated from impressions is high quality.
- Revenue Per Thousand Impressions (RPM): Adds a monetization layer, helping assess whether impressions are generating proportional value.
- Return on Ad Spend (ROAS): Ensures exposure cost aligns with revenue return.
Diagnostic Checks
- CPM Trends by Audience Segment: Identify whether certain segments are inflating costs or becoming saturated.
- CPM Changes After Creative Updates: Monitor how new creative impacts auction dynamics and delivery efficiency.
- Frequency vs CPM Interaction: High frequency can drive CPM increases and audience fatigue.
Governance Considerations
- Clear Definitions of Impressions: Ensure all platforms use consistent standards for counting impressions.
- Consistent Reporting Windows: Align date ranges across channels before comparing CPM.
- Avoid CPM Optimization Without Downstream Validation: Lowering CPM should not come at the expense of engagement, conversion, or revenue performance.
CPM Implementation Plan
Implementing CPM effectively requires more than plugging numbers into a dashboard. It requires structure, alignment, and ongoing validation.
Step 1: Baseline Current CPMs
Start by documenting historical CPMs by channel, campaign type, and audience segment. Establish realistic benchmarks using at least one to three months of data. This creates a reference point for evaluating future performance.
Step 2: Audit Calculation Consistency
Verify that CPM is being calculated the same way across teams and tools. Confirm that total spend and total impressions align by date range, currency, and platform definition. Eliminate manual spreadsheet formulas that introduce inconsistencies.
Step 3: Integrate CPM Into Planning Model
Incorporate CPM assumptions into budget forecasting and scenario planning. Use expected CPM ranges to project reach and spend requirements. Ensure growth, finance, and media teams are aligned on these assumptions before campaigns launch.
Step 4: Ongoing Optimization and Guardrails
Monitor CPM trends regularly, but avoid optimizing it in isolation. Pair CPM with CTR, CPA, and revenue metrics to ensure efficiency gains do not undermine performance. Revisit benchmarks quarterly to account for seasonality, competition, and market shifts.
CPM Is a Planning Tool, Not a Performance Verdict
CPM measures the cost of exposure, not the value of outcomes. It tells you how expensive attention is, but not whether that attention converts.
Accurate CPM calculation depends on consistent definitions, aligned reporting windows, and clean inputs. Even small inconsistencies in impressions or spend can distort comparisons across channels. Most importantly, CPM should always be evaluated alongside downstream performance metrics like CTR, CPA, and revenue per thousand impressions.
When used in context, CPM becomes a powerful planning input. It supports smarter budgeting, clearer forecasting, and more disciplined media decisions, without pretending to be a final measure of success.


.avif)


%25201.avif)


.avif)


.svg)
