


Most data problems do not begin in dashboards, but in the logic that connects one system to another.
Data mapping is critical because it defines how fields align, how definitions are interpreted, and whether numbers can be trusted across tools. When mappings are unclear or inconsistent, even the most sophisticated reporting becomes unreliable.
In this guide, we will explain what data mapping is and why it underpins accurate measurement. We’ll share practical data mapping examples for marketing data and outline a structured approach to implementing and maintaining it over time.
The goal is for you to be able to treat data mapping as a repeatable discipline that keeps your data aligned as your systems, tools, and teams evolve.
What Data Mapping Is And Why It Matters
Data mapping is the process of defining how fields from one system connect to fields in another. It answers practical questions like: Which source field populates this destination field? What format should it be in? Should it be transformed, normalized, or combined with other values?
In simple terms, data mapping creates the blueprint that allows systems to agree on what data means and how it moves.
Data mapping is not the same as ETL (Extract, Transform, Load) or reporting.
- ETL moves and transforms data.
- Reporting visualizes it.
- Data mapping sits upstream of both, defining the logic that makes those processes reliable.
If the mapping is wrong, the pipeline may run perfectly and the dashboard may look polished, but the numbers will still be misleading.
And mapping errors do cascade. A mismatched identifier can break attribution; an inconsistent definition of revenue can distort performance reporting; a missing normalization rule can inflate counts across systems.
When mapping is ignored early, downstream trust erodes, and teams spend more time debugging than deciding.
Data Mapping Best Practices and Examples
A reliable data mapping process starts with structure and clarity. Each component builds on the next, ensuring that data moves accurately, consistently, and in a way that supports downstream reporting and decision-making.
Source Systems and Ownership
Every mapping begins with clearly defined source systems. This includes marketing platforms, CRM, product databases, finance tools, and any system contributing data.
Just as important is ownership. Each source should have a responsible team or individual who understands how the data is generated, maintained, and changed. Without ownership, inconsistencies and silent schema changes go unnoticed.
Fields, Formats, and Data Types
Mapping requires field-level precision. Teams must define exact field names, formats, and data types. Is a date stored as a timestamp or string? Is revenue recorded in cents or dollars? Small mismatches in format or type can create large downstream discrepancies.
Transformation and Normalization Rules
Not all data can be copied directly from source to destination. Transformation rules define how values are cleaned, standardized, combined, or filtered. Normalization ensures consistency across systems, such as aligning country codes, campaign naming conventions, or currency formats.
Destination Schema and Definitions
The destination schema defines how data should look once integrated. Clear definitions for metrics, dimensions, and relationships prevent ambiguity. A shared understanding of what each field represents reduces reporting disputes later.
Documentation and Version Control
Data mappings should be documented and treated as living artifacts. Version control ensures changes are tracked, reviewed, and communicated, preventing unexpected breaks in reporting.
How to Visualize Data Mappings Clearly
Clear visualization turns data mapping from a technical artifact into a shared reference. The right format helps teams understand how data flows, where transformations occur, and how systems connect.
Here are a few best practices to keep in mind:
How to Create a Data Mapping Diagram: Tables, Flowcharts, Entity Relationships
Different visualization types serve different purposes:
- Tabular mapping is ideal for field-level detail, showing source fields, destination fields, data types, and transformation rules in a structured format.
- Flowcharts help illustrate how data moves between systems, making dependencies and handoffs visible.
- Entity relationship diagrams clarify how tables connect through keys and identifiers, which is especially useful in warehouse environments.
When to Use Visual vs Tabular Formats
Tables are best for precision and documentation, while diagrams are better for communication and alignment. Early planning conversations often benefit from visual flow diagrams, while implementation requires detailed mapping tables. Mature teams typically maintain both.
Keeping Mappings Readable as Systems Scale
As data integration mapping expands, mappings can become dense and difficult to interpret. Group related fields, separate logical domains, and avoid overcrowded diagrams. Modular documentation keeps complexity manageable.
Naming Conventions and Annotations
Consistent naming conventions reduce ambiguity. Annotations should explain transformations, exceptions, and assumptions. Clear labeling prevents future confusion when systems evolve.
Making Mappings Usable for Non-Technical Teams
Visualization should not exclude business stakeholders. Simplified diagrams, plain-language definitions, and contextual notes help non-technical teams understand how data supports reporting and decisions.
Common Data Mapping Challenges and How to Solve Them
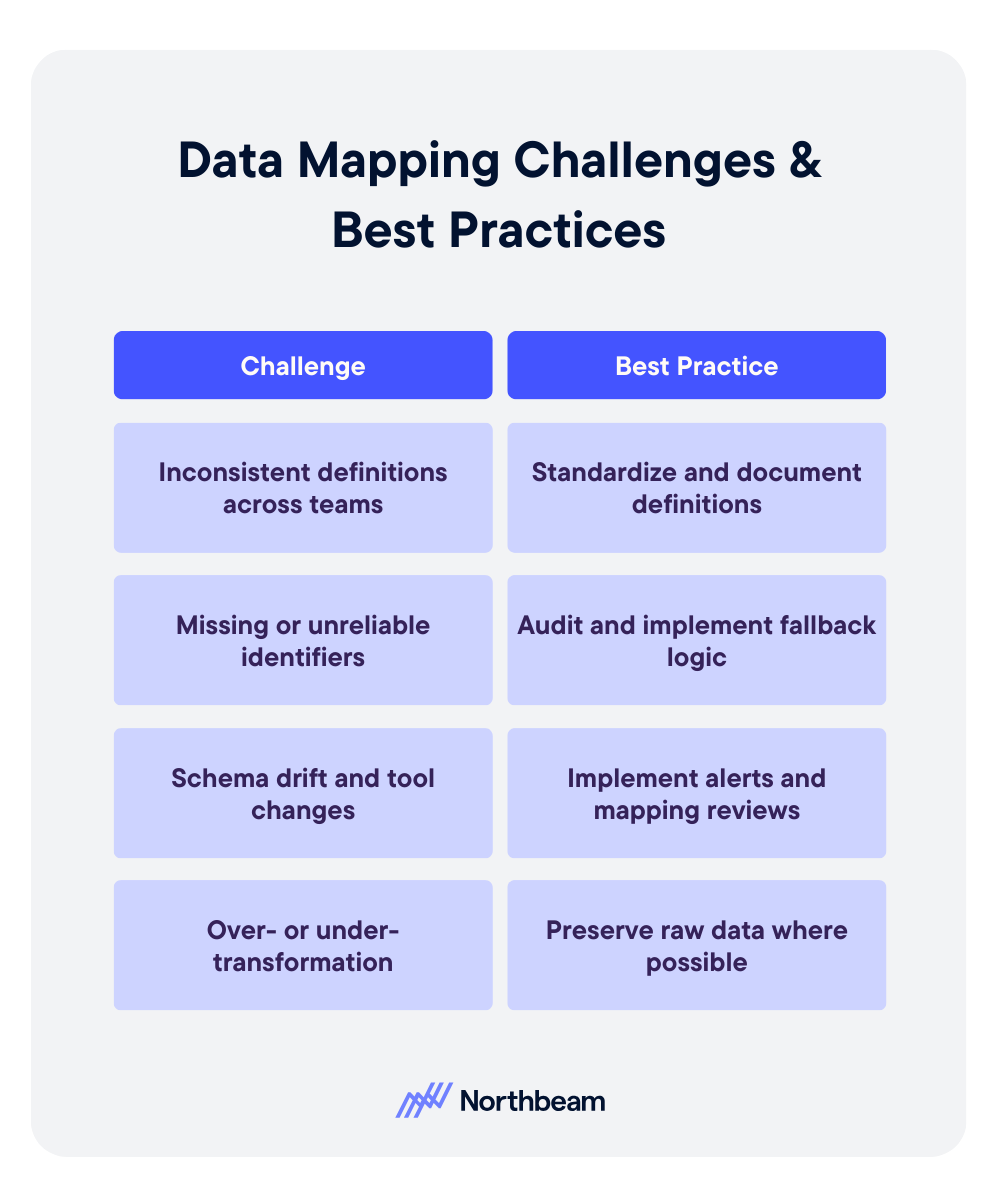
Even well-designed mappings can break down over time. Most failures are not technical at their core; they stem from unclear definitions, shifting systems, or over-engineered logic.
Inconsistent Definitions Across Teams
Problem:
- Marketing defines revenue one way. Finance defines it another. Product tracks users differently than CRM tracks contacts.
- When teams operate with conflicting definitions, mapped fields may technically connect, but the meaning behind them diverges.
- This creates reporting discrepancies and ongoing reconciliation debates.
Solution:
- Establish standardized definitions and document them in a shared field dictionary.
- Align stakeholders before implementation, not after discrepancies appear.
- Governance reviews should include semantic validation, not just technical checks.
Missing or Unreliable Identifiers
Problem:
- Mappings depend on stable keys.
- If identifiers such as user IDs, order IDs, or campaign names are missing, inconsistent, or overwritten, joins fail and attribution breaks.
Solution:
- Prioritize durable identifiers early.
- Where gaps exist, implement fallback logic and enforce naming conventions.
- Audit identifier completeness regularly to prevent silent data fragmentation.
Schema Drift and Tool Changes
Problem:
- Vendors update APIs, fields are renamed, and new properties are added.
- Without monitoring, mappings degrade quietly, leading to incomplete or incorrect data downstream.
Solution:
- Implement schema change alerts and periodic mapping reviews.
- Treat integrations as living systems that require maintenance, not static infrastructure.
Over- or Under-Transformation
Problem:
- Too little transformation leaves inconsistencies unresolved.
- Too much transformation obscures source truth and complicates debugging.
Solution
- Apply only the transformations required for downstream use cases.
- Preserve raw data where possible, and document every rule clearly.
Data Mapping KPIs to Measure
Strong data mapping does not just improve integration accuracy, it also improves measurable operational outcomes. When mappings are well designed and actively maintained, teams spend less time debugging and more time making decisions.
Core KPIs influenced by effective data mapping include:
- Data completeness and freshness: Are expected fields populated, and are datasets updating on schedule?
- Error and reconciliation rates: How often do reports require manual correction or adjustment?
- Reporting consistency across systems: Do marketing, finance, and product dashboards align on shared metrics?
- Time-to-diagnosis for data issues: How quickly can teams trace discrepancies back to a specific field or transformation rule?
Monitoring these indicators helps detect mapping weaknesses early. Beyond KPIs, teams should implement regular diagnostic checks, such as:
- Field-level reconciliation samples to confirm values match across source and destination systems.
- Schema change impact reviews when APIs or tools update.
- Downstream report variance checks to identify unexpected swings caused by structural changes.
Mapping quality rarely fails loudly. Usually, it degrades quietly. Proactive measurement ensures small inconsistencies do not evolve into systemic reporting distrust.
Data Mapping Governance Considerations
Data mapping is not a one-time technical task; it requires ongoing governance to remain reliable as systems evolve and teams grow. Without structure and accountability, even well-designed mappings degrade over time.
Governance considerations should include:
Clear Ownership Per Data Domain
Every data source and destination should have a defined owner responsible for accuracy, changes, and documentation. Ownership ensures someone is accountable when discrepancies arise and prevents silent updates from breaking integrations.
Change Approval and Documentation Standards
Schema changes, new fields, and transformation updates should follow a documented review process. Version control and change logs help teams understand what changed, why it changed, and how it affects downstream reporting.
Regular Audits and Refresh Cycles
Periodic audits validate that mappings still align with business definitions and system configurations. Refresh cycles allow teams to clean up deprecated fields, adjust logic, and ensure the mapping framework continues to support evolving reporting needs.
Governance transforms mapping from a fragile setup into durable infrastructure.
Example Data Mapping Workflow
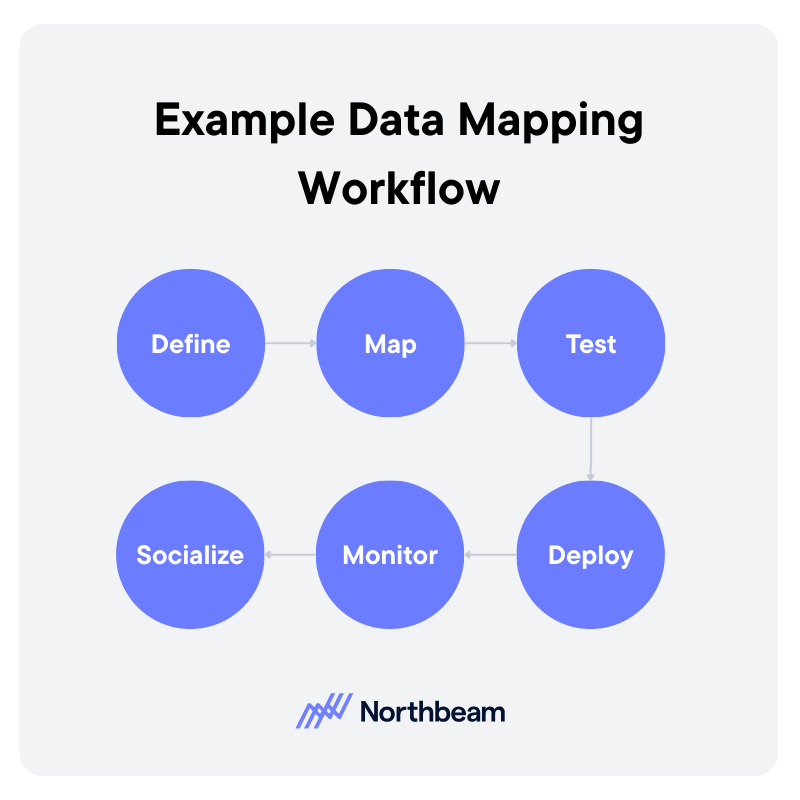
A strong data mapping workflow is iterative and collaborative. It moves from definition to deployment, then continues through monitoring and refinement.
1. Define
Start by clarifying the use case and downstream requirements. What reports, dashboards, or models will depend on this mapping?
Identify source systems, required fields, definitions, and ownership. Clear scope prevents unnecessary transformations and keeps the mapping aligned with business needs.
2. Map
Document how each source field connects to the destination schema. Define transformation rules, normalization logic, and key relationships.
This step should produce a structured mapping artifact, such as a field-level table or diagram, that can be reviewed by stakeholders.
3. Test
Validate mappings before full deployment. Run reconciliation checks, confirm identifier integrity, and compare sample records across systems. Testing ensures that technical accuracy aligns with business definitions.
4. Deploy
Move the mapping into production pipelines or sync jobs. Ensure version control and documentation are updated to reflect the deployed configuration.
5. Monitor
After deployment, monitor data freshness, completeness, and report consistency. Investigate anomalies quickly to prevent silent degradation.
6. Socialize
Effective mapping requires coordination across analytics, engineering, operations, and business teams. Shared visibility and structured review cycles reduce friction and build trust in the resulting data.
From Integration to Insight
Data mapping tools and workflows determine whether systems align or quietly contradict each other. When mappings are thoughtfully designed and clearly documented, data moves with context and consistency instead of ambiguity.
Visual examples and structured artifacts make the logic understandable across technical and non-technical teams. Just as important, governance keeps mappings from degrading over time. Ownership, reviews, and validation routines ensure small changes do not turn into systemic reporting errors.
Strong data mapping is not just an integration task, but the very foundation for trustworthy measurement, reliable attribution, and confident decision-making.


.avif)


%25201.avif)


.avif)


.svg)
