


Planning Q1–Q2 2026: Lessons from Last Year's Performance Patterns
How to Pace Q1–Q2 2026 Using Median Month-by-Month and Industry Data
As teams pace spend across Q1 and Q2 2026, most are watching a mix of signals: revenue trends, CAC stability, contribution margin, and how first-time performance is tracking relative to plan. The median data from 2025 suggests those mixed signals are not unusual in early Q1. Revenue growth in January and February did not consistently align with improvement in first-time revenue or first-time MER.
Now, with January and February 2026 data in hand, we can place those months directly against their 2025 counterparts. The picture is more encouraging on revenue. The structural tension in new-customer economics persists.
Early Q1 at the Median: 2025 Set a Low Bar

In January 2025, the median business grew revenue 4.33 percent year over year. But beneath that:
- First-time revenue declined 1.57 percent
- First-time MER fell 6.24 percent
- First-time CAC increased 6.58 percent
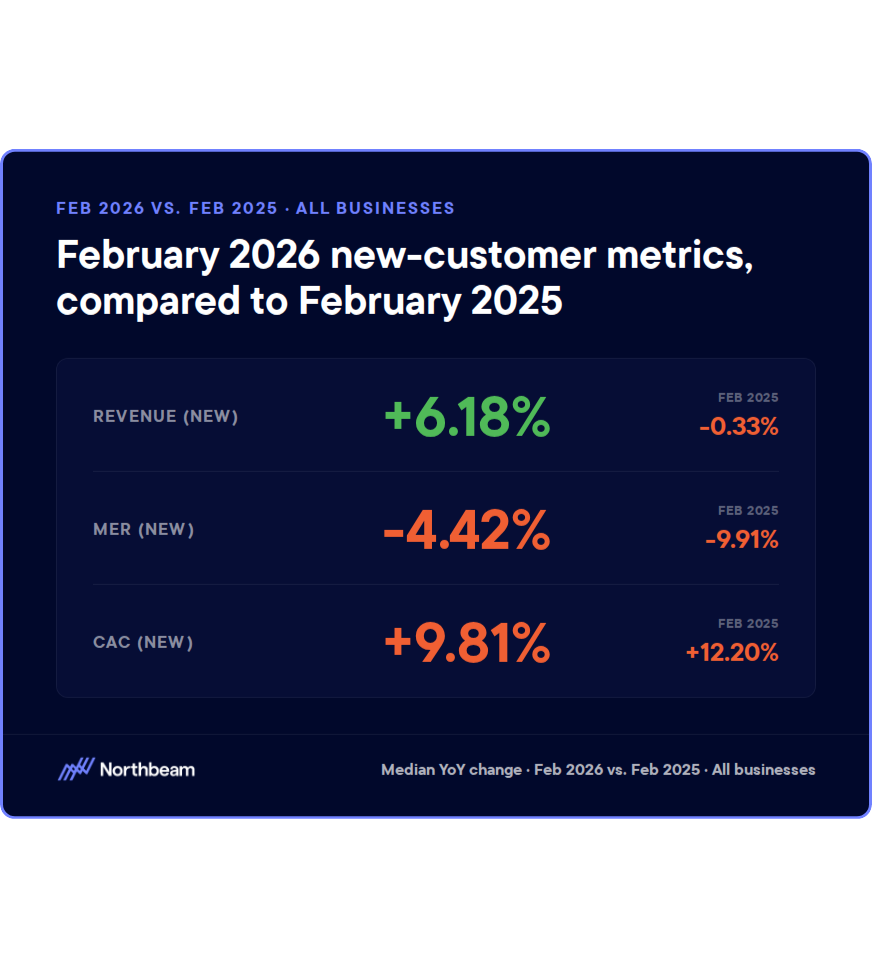
February 2025 was worse. Median revenue grew just 2.06 percent while first-time MER fell 9.91 percent and new CAC rose 12.20 percent. It was one of the most compressed acquisition months in the full-year dataset.
January and February 2026: Better Revenue, Same Structural Gap
The topline improvement in early 2026 is real and meaningful.
What improved: Revenue accelerated sharply. February 2026 at +9.05 percent versus +2.06 percent a year earlier is nearly a 7-point gap. New revenue flipped positive in both months. First-time MER narrowed by 5.5 points in February versus the prior year.
What has not resolved: New CAC kept rising year over year. New MER stayed negative in both months. The gap between topline and acquisition efficiency has narrowed, but it has not closed.
"Early Q1 2026 is tracking ahead of 2025 on every revenue measure. But the structural pattern holds: new-customer economics remain under pressure in January and February regardless of the topline environment."
The 2025 Spring Inflection: What Actually Happened
January and February 2025 were the two worst months of the year for first-time MER. Then something shifted.
In March, median first-time revenue turned positive for the first time. By May and June, the picture looked different:
- May: revenue +6.82%, new revenue +3.95%, new MER -5.19%
- June: revenue +8.84%, new revenue +4.47%, new MER -3.43%
These were the months where the median operator could scale and maintain efficiency simultaneously. That window lasted roughly four months before efficiency began compressing again in the second half.
What Q2 2026 Might Look Like
The narrowing first-time MER gap is the most actionable forward signal. In February 2025 new MER was nearly 10 points negative. In February 2026 it was 4.4 points negative. If that trajectory continues into March and April, the spring window for efficient acquisition may begin sooner and scale more cleanly than it did last year.
Two caveats: new CAC is still rising year over year, setting a higher floor for what efficient acquisition costs. And 2025's spring improvement was concentrated and did not persist into the second half. A strong Q2 does not guarantee a strong Q3.
"The spring inflection in 2026 could arrive earlier and reach a higher ceiling than it did last year. But only for brands that built the creative and budget infrastructure to meet it."
For budget pacing specifically:
- Watch March closely as a potential earlier inflection than 2025 provided
- Target April through June as the primary acquisition window
- Set explicit CAC ceilings that account for year-over-year cost inflation
- Ensure creative velocity built in Q1 is ready to support Q2 scale
Industry Windows Worth Knowing
Sporting Goods & Fitness. February through May are the primary acquisition months. Full-year 2025 saw median spend up 25 percent and revenue up 16.66 percent, but new MER fell 11.11 percent. January is for offer and creative prep. The improving early-Q1 backdrop may extend the usable window slightly in 2026.
Health & Wellness. Resolution season can drive January volume, but 2025 showed the window closes fast. Full-year median revenue grew only 4.26 percent despite spend rising 9.42 percent. New-customer growth was almost entirely concentrated in Q1 and Q2. New MER fell sharply from August through December. Caution from Q3 onward is warranted.
Fashion & Accessories. First-time MER was negative in every single month of 2025. Late spring, particularly June (new revenue +9.30 percent median), offered better conditions than early Q1 or late Q4. Early revenue stabilization should not trigger heavy prospecting before the calendar supports it.
Home & Furniture. May and August are historically the cleanest acquisition windows. May 2025 delivered median MER of +5.05 percent. Full-year new CAC rose 9.47 percent. Use Q1 for testing and treat February through April as a controlled-motion period with strict payback targets.
Size Still Determines the Margin for Error
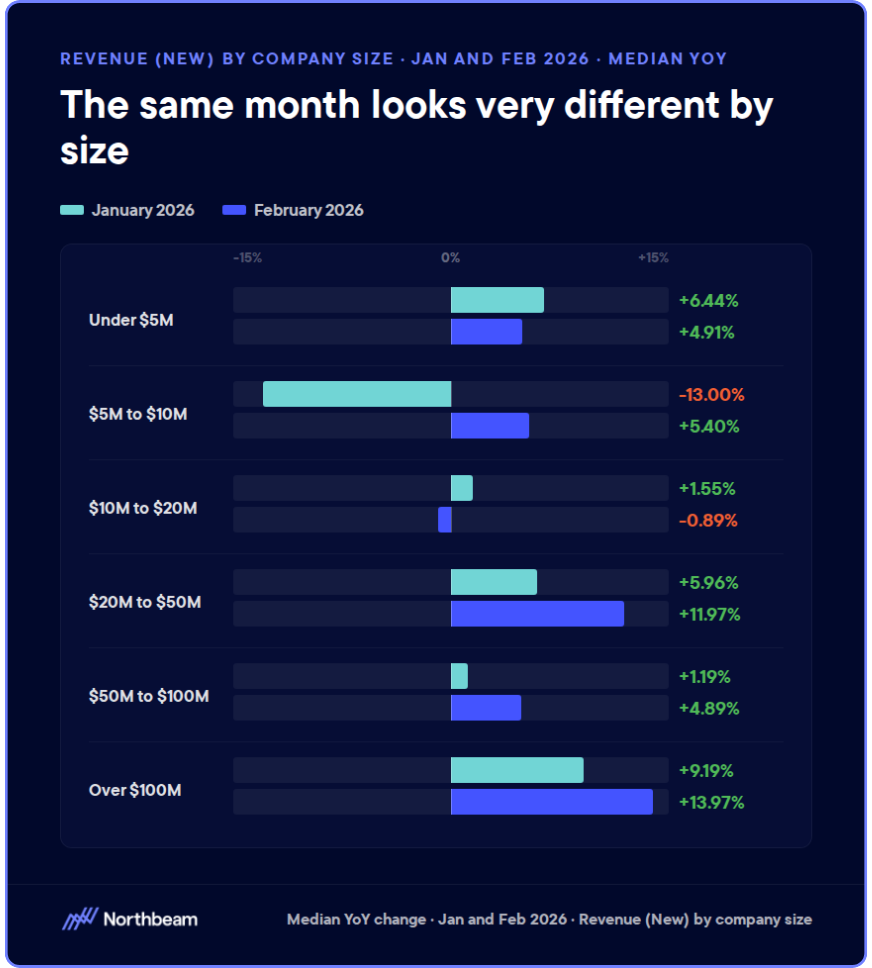
In 2025, sub-$5M businesses saw median revenue decline 1.43 percent despite modest spend increases. The $50M-$100M band grew revenue 15.28 percent. The $100M+ band grew 15.19 percent.
The 2026 aggregate improvements are real, but unevenly distributed. Smaller businesses should not read a strong aggregate headline as license to front-load spend. The improving early-Q1 environment helps larger operators most. For smaller brands, Q1 discipline from 2025 still applies.
The Bottom Line
January and February 2026 are tracking materially ahead of 2025. Topline is stronger. New revenue is positive. The first-time MER gap is narrowing. But the structural compression of early Q1 has not disappeared, and new CAC continues rising year over year.
"The goal is not to under-spend in Q1. It is to recognize that cleaner scaling conditions historically emerge in spring, and to position budget, guardrails, and creative accordingly."
The spring window is shaping up to be stronger than last year. The brands that capture it will be the ones that treated early Q1 as infrastructure rather than acceleration.


.avif)


%25201.avif)


.avif)


.svg)
