


The marketing world is full of metrics, and few cause more confusion than MER and ROAS.
On the surface, they seem interchangeable. In reality, they serve different purposes, and knowing which to prioritize can mean the difference between scaling profitably and burning through budget.
As marketers juggle cash flow, growth targets, and increasingly complex customer journeys, choosing the right metric at the right time can dramatically shift outcomes.
The wrong focus can create blind spots; the right one can sharpen your strategy and unlock stronger returns.
In this guide, we’ll break down what each metric measures, how they differ, and when to use each of them.
You’ll learn how to combine MER’s big-picture view with ROAS’s tactical precision to drive both short-term wins and long-term growth.
Let’s dive in.
What Is Marketing Efficiency Ratio (MER)?
Marketing Efficiency Ratio (MER), also called Media Efficiency Ratio, measures the relationship between the total revenue your business generates and your total marketing or advertising spend.

The Marketing Efficiency Ratio formula is simple: MER = Total Revenue ÷ Total Marketing/Ad Spend
Unlike campaign-level metrics, MER takes a top-down, holistic view of performance. It looks at all channels and campaigns together, showing you how efficiently your total marketing investment is converting into revenue.
This broad scope is why MER is sometimes referred to as blended ROAS or eROAS.
Instead of focusing on the return from a single campaign, it captures the cumulative effect of all your marketing activity, including brand-building efforts, halo effects from organic traffic, and cross-channel influence.
In some industries, you may also see MER framed as TACoS (Total Advertising Cost of Sale).
While the name is different, the concept is the same: understanding how much revenue you’re generating for every dollar spent across all marketing efforts, not just one slice of the pie.
💡To Recap: Marketing Efficiency Ratio (MER) is also sometimes referred to as Media Efficiency Ratio, blended ROAS, eROAS, or TACoS.
By focusing on the big picture, MER helps marketers cut through platform-by-platform noise and answer the most important question: Is my marketing spend making the business more profitable overall?
What Is ROAS?
Return on Ad Spend (ROAS) measures the revenue generated by a specific campaign or channel compared to the amount spent on it.

The formula is: Revenue from a Specific Campaign ÷ Campaign Ad Spend = ROAS
Because it isolates performance at the campaign level, ROAS is highly precise.
It’s ideal for identifying which ads, audiences, or platforms are delivering the best return — and where to optimize or reallocate budget for maximum impact.
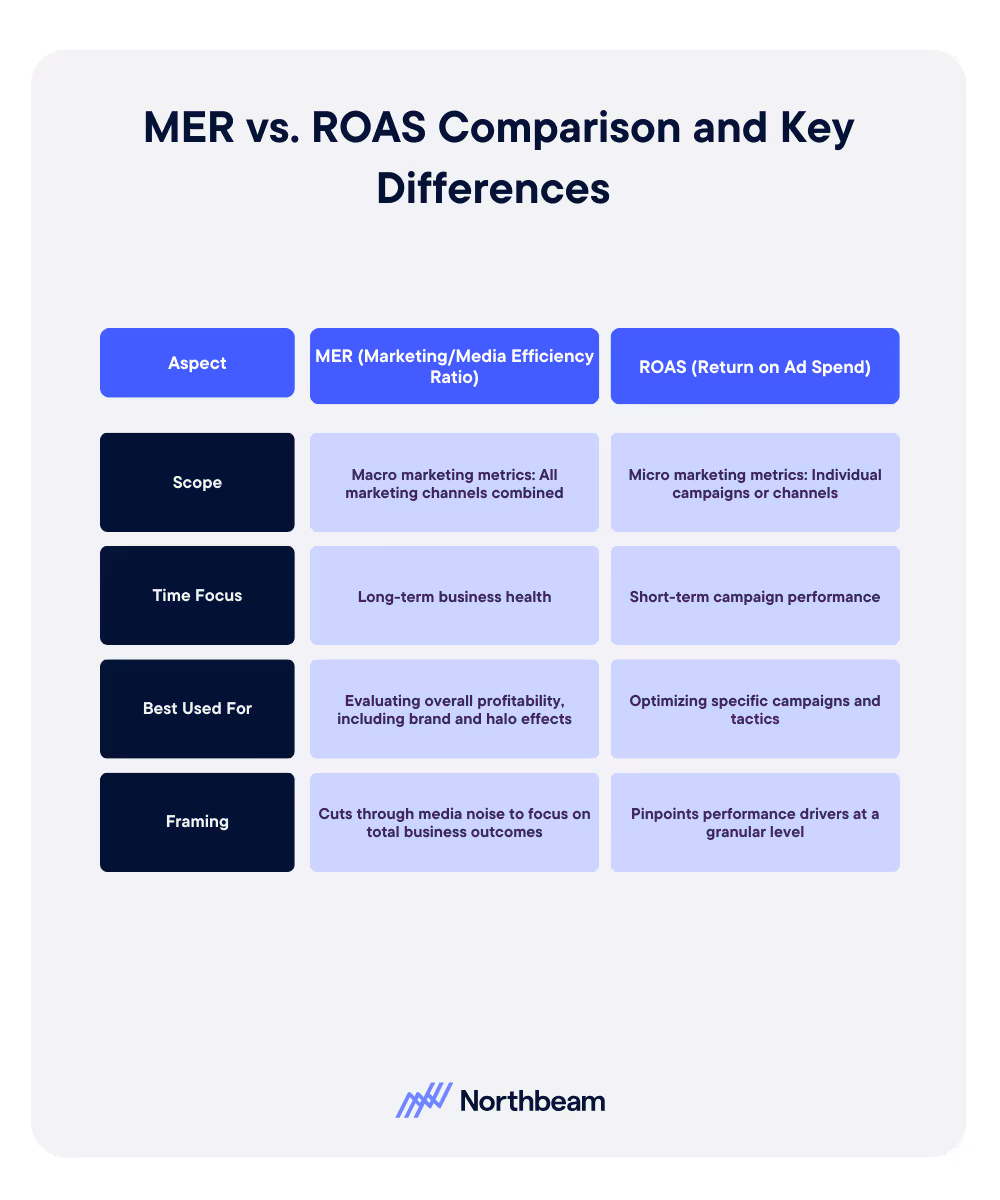
MER vs. ROAS Comparison and Key Differences
Both metrics have value: MER gives you the big-picture efficiency view, while ROAS helps you fine-tune at the ground level.
Together, they create a complete performance snapshot.
Why MER Matters Today
In an era of fragmented customer journeys and stricter privacy rules, attribution data is often incomplete. This is where MER shines.
Platform-reported ROAS can be misleading if it only counts conversions that can be directly tracked back to clicks or views.
For example, a customer who sees an Instagram ad, reads a blog post, and then purchases via an organic search might be invisible to that campaign’s ROAS — but MER captures the revenue regardless of the path taken.
As another example, imagine a DTC brand running paid search, paid social, and influencer partnerships saw an average ROAS of 2.0 in Meta Ads Manager.
However, when they calculated MER across all channels, the ratio was 3.5, revealing that paid social was driving halo effects in organic and email sales that platform metrics couldn’t see.
In omnichannel environments, where customers interact with multiple touchpoints before converting, MER becomes the true efficiency metric.
It sidesteps attribution gaps by focusing on actual business outcomes (total revenue vs. total marketing investment) giving marketing leaders the clarity they need to make strategic decisions.
When to Use MER vs. ROAS
Both MER and ROAS have their place. The key is knowing when to lean on each.
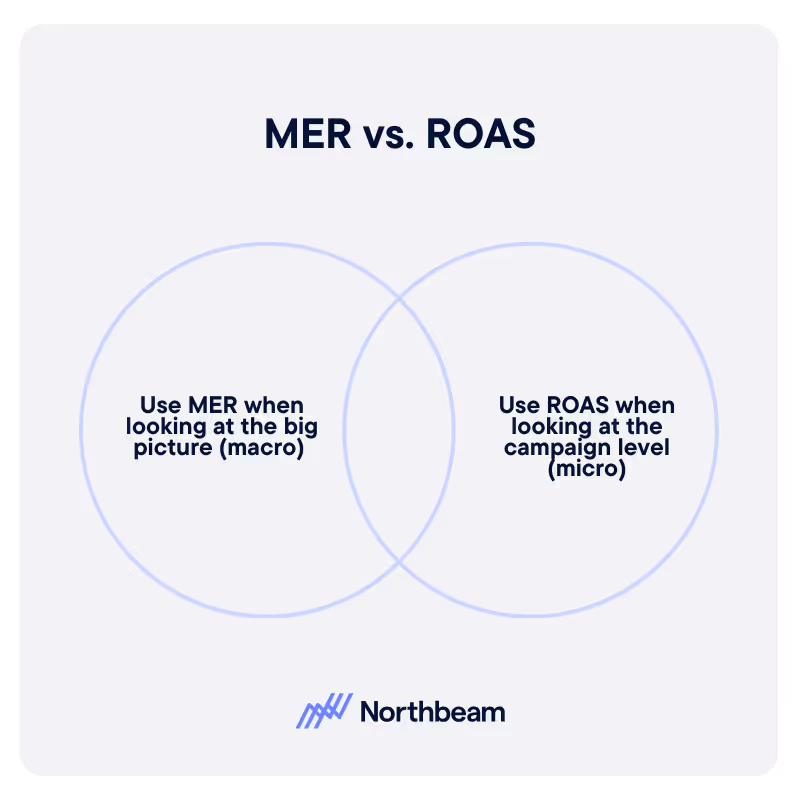
Let’s do a quick MER vs ROAS comparison:
Use MER when:
- Evaluating brand-wide health and overall profitability.
- Planning long-term budgets or proving ROI to stakeholders (e.g., CMO or board-level reporting)
- Measuring the combined impact of brand-building, organic growth, and paid media.
Use ROAS when:
- Optimizing the performance of an individual campaign or channel.
- Allocating budgets tactically across platforms based on near-term results.
- Testing creative, targeting, or bidding strategies for quick performance insights.
By pairing these metrics, you can make high-level strategic decisions while still fine-tuning the details that drive day-to-day performance.
Benchmarking MER & Best Practices
A good MER benchmark often falls around 5.0 or higher, meaning your business is generating $5 in revenue for every $1 spent on marketing.
However, good MER benchmarks can vary widely by industry, business model, and growth stage.
A scaling startup might operate with a lower MER in the short term, while a mature brand might aim for a higher ratio to sustain profitability.
Here are three best practices for using and improving MER effectively:
Standardize Your Inputs
Clearly define which revenue streams (e.g., online sales, retail, wholesale) and marketing costs (e.g., ad spend, agency fees, creative production) are included in your MER calculation.
Inconsistent definitions can distort trends and make it difficult to compare performance over time.
By keeping the inputs uniform, you ensure your MER is a true reflection of changes in efficiency, not changes in how you’re counting.
Track Continuously
Treat MER as a rolling benchmark, reviewing it monthly or quarterly rather than just at year-end.
This allows you to see the impact of campaigns, seasonal shifts, or budget adjustments in near real time.
Consistent tracking makes it easier to spot early warning signs or capitalize quickly on positive trends.
Pair MER with ROAS
MER delivers the big-picture view of how all marketing is working together, while ROAS zooms in on individual campaigns.
Using both ensures you can make strategic, company-wide decisions without losing sight of tactical optimizations.
This dual approach helps you balance long-term growth goals with short-term performance wins.
When applied consistently, MER becomes more than just a number: it’s a dependable signal for whether your overall marketing strategy is driving sustainable business outcomes.
MER and ROAS: The Full Picture
MER and ROAS aren’t competing metrics, they’re complementary tools.
MER gives you macro marketing metrics for overall marketing efficiency, showing how every channel works together to drive revenue.
ROAS delivers the micro-level insights you need to fine-tune specific campaigns and tactics.
The question is: Are your metrics driving clarity or creating blind spots?
By tracking both MER and ROAS, you can make confident decisions that support short-term wins and long-term growth.


.avif)


%25201.avif)


.avif)


.svg)
